

Key Takeaways
Start with the business decision, not the algorithm
The real work. Data science combines mathematical and statistical reasoning, coding, subject-matter expertise, and communication to turn raw information into useful conclusions. Without knowledge of the field being studied, a practitioner may calculate correctly but misunderstand what the result means. A healthcare model, for example, requires more than programming skill: its findings must make sense in clinical context.
Value with purpose. In business, data work should improve revenue, reduce waste or risk, or support a product. But the book also insists that a project fit the company’s mission and values. A profitable result that undermines the purpose of the organization is not a successful result by this standard.
What's striking is the book's refusal to define data science as a contest in technical sophistication. This aligns with decision science, where the value of an analysis depends on whether it changes a consequential choice. Domain knowledge also helps reveal when a clean-looking result is actually nonsensical. The necessary caution is that profit is an incomplete measure of value: a project can improve a balance sheet while shifting costs onto customers, workers, or the public. Mission and values are useful constraints only when they meaningfully shape decisions.
Treat data engineering as core work, not technical housekeeping
Build the supply line. Data engineering creates and maintains the systems that capture, move, store, and prepare data. Data science uses that supply to analyze and interpret information. The challenge of big data is often described through volume, velocity, and variety: how much arrives, how quickly it moves, and how many formats it takes. A spreadsheet, sensor stream, and collection of emails do not become one useful dataset by wishful thinking.
Avoid buying the hype. The book recounts how companies invested heavily in Hadoop clusters before establishing whether they fit a real need. Many projects failed. Its lesson is not that Hadoop is useless, but that storage and processing choices must follow an assessed use case. Cloud warehouses, on-premise systems, and real-time tools each solve different problems.
The supply-line metaphor captures a persistent truth about technical work: models depend on reliable inputs, and infrastructure choices create long-lived costs. The Hadoop example also illustrates how procurement can outrun diagnosis. Still, cloud is not automatically safer or cheaper for every organization. Regulation, latency, existing contracts, and operational expertise affect the trade-off. The sound principle is to compare options against actual requirements, not to replace one fashionable default with another.
Match learning methods to labels, timing, and uncertainty
Choose the learning setup. Supervised machine learning learns from labeled examples to predict outcomes for new cases. Unsupervised methods search unlabeled data for structure, such as customer groups. Reinforcement learning adjusts behavior in response to rewards. These approaches answer different questions, so selecting an algorithm begins with identifying what is known and what must be predicted.
Test beyond the training data. The book describes splitting data into training and test sets, with a common rule of thumb of using about two-thirds for training and one-third for testing. A model that memorizes quirks in its training data may fail on new cases, a problem called overfitting. Regression and correlation can describe relationships, but forecasts based on past patterns can become unreliable when conditions change.
The distinction between learning modes is useful because it makes algorithm choice a question of evidence, not fashion. The training and test split is an early defense against self-deception: a model should face examples it did not learn from. Yet a single random split cannot guarantee real-world performance, especially when time, geography, or population changes matter. Evaluation should mimic the conditions of actual use, and prediction should not be mistaken for proof that one variable causes another.
Use the simplest decision-support tool that answers the question
Match complexity to need. Business intelligence summarizes historical company data, often through reports and dashboards. Analytics can also work with external or real-time data. Data science adds methods such as machine learning to find patterns and make predictions. The book distinguishes four analytical aims: describe what happened, diagnose why, predict what may happen, and prescribe an action.
Start accessible. SQL retrieves and combines structured data; Excel can quickly expose patterns through filters, charts, and PivotTables. No-code and low-code tools can automate routine work without requiring every employee to become a programmer. A predictive model is warranted when these simpler tools cannot answer the decision at hand, not merely because machine learning sounds more impressive.
This is a valuable antidote to solutionism. The decision-support ladder helps teams spend technical effort only where uncertainty justifies it. A clear report may outperform a complex model if the decision is recurring and the relevant facts are already known. The limitation is that labels such as descriptive or predictive can obscure assumptions and data quality. A dashboard is not neutral simply because it contains no algorithm; what it measures and omits still shapes organizational attention.
Design each visualization for one audience and one decision
Know the viewer. The book distinguishes data storytelling for decision-makers, data showcasing for analysts, and data art for audiences moved by a public or political message. Storytelling interprets findings and directs attention. Showcasing gives analytical viewers room to inspect evidence. Data art uses design to make a forceful statement, while still requiring accurate representation.
Choose the graphic deliberately. Bar charts compare categories, line charts reveal change over time, and scatterplots can expose relationships or outliers. A visualization should be tested against the question it is meant to answer. Context can come from annotations, benchmarks, or additional data, but too much detail can distract a decision-maker. A graphic that looks elegant but hides the comparison is a poor instrument.
The audience-first approach connects visualization to interface design: a chart is not merely a picture of results, but a tool that directs attention and supports action. It also recognizes that analysts and executives need different levels of detail. The ethical boundary matters most when a design aims to persuade. Emotional force can help neglected evidence gain attention, but it can also make selective framing feel like proof. Accuracy and visible context must constrain the aesthetics.
Measure operational AI by business outcomes, not model accuracy
Follow the results. The book illustrates data science across manufacturing, logistics, customer service, and media. The Associated Press used automated story generation to produce 4,400 quarterly earnings reports, roughly fifteen times its previous output, and freed reporters to do other work. At Humana, an AI tool that analyzed call interactions was associated with a 28 percent increase in customer satisfaction and a 63 percent increase in employee engagement.
Separate forecasts from results. UPS built network planning tools to reroute parcels around disruptions; the book says the company expected savings of hundreds of millions of dollars annually, not that this amount was already proven. Marketing offers another application: marketing mix modeling uses sales and marketing history to estimate how product, price, place, and promotion relate to sales.
These cases make the strongest argument for connecting models to workflow: value appears when a system changes what people can accomplish, not when a benchmark score rises. They also show that automation may augment human work rather than simply replace it. However, reported improvements do not by themselves establish that the AI caused every gain. A careful project tracks baselines, costs, adoption, and unintended effects alongside headline outcomes.
Choose a quick win your company can build with assets it owns
Inspect before proposing. The book’s staged planning approach begins by surveying data use cases, then taking stock of a company’s technologies, data, people, and constraints before recommending a project. It advises favoring a quick win that can show a positive return within about three months without major new investments. A use case that requires data, skills, or infrastructure the company cannot readily access is not a practical first choice.
Trace the consequences. The POTI model prompts planners to examine effects on processes, organization, technology, and information. A proposal should also fit the company’s mission and vision. The finished plan records alternatives, users, risks, milestones, and responsibilities, so implementation is more than a promising model in search of an owner.
This planning discipline resembles staged investment: validate feasibility before committing scarce resources. Its attention to people and information flows is especially important because technical deployments often fail through poor adoption or inaccessible data, not inadequate algorithms. The three-month target is a useful forcing function, but it should not become a universal rule. Some public-interest or safety projects have long horizons, and their value may not appear as immediate revenue.
Make data quality and explainability requirements, not cleanup afterthoughts
Trust starts upstream. Data silos, inconsistent formats, missing values, and multiple undocumented copies can make employees distrust results and repeat one another’s work. Data governance sets shared definitions and practices for managing data quality. The book’s data-preparation sequence includes importing, cleaning, transforming, processing, documenting, and backing up data before analysis.
Demand accountable AI. The book argues that AI should be accountable, explainable, and unbiased. Teams should know what data and models a system uses, have documentation that explains its operation in plain language, and test whether its outputs disadvantage groups. It illustrates the stakes with a reported oncology system recommendation that conflicted with a serious bleeding risk. High-stakes decisions need human scrutiny, not blind deference to software.
The connection between governance and ethics is well made: a system cannot be meaningfully audited if its data lineage and decision logic are opaque. The clinical example shows why accuracy is not an abstract engineering concern. At the same time, explanations can be incomplete or persuasive without being faithful to a model’s behavior. Documentation should be paired with independent testing, clear accountability, and a way to challenge consequential decisions.
Treat personal data as a liability as well as a revenue source
Monetization has costs. Companies may earn money by selling data services, data products, or access to audiences through targeted advertising and data partnerships. The book describes SafeGraph’s location-data business, which bought information from app developers and packaged it for commercial customers. Such arrangements can be lucrative, but people may not understand how their information is collected, combined, or resold.
Privacy changes the strategy. The Cambridge Analytica scandal and data-protection rules such as the European Union’s GDPR made consent and explanation more consequential. The book also discusses Apple’s restrictions on user tracking, which reduce the data available for ad targeting and measurement. A durable data business must account for permission, transparency, and trust, rather than treating personal information as a free raw material.
The commercial logic is clear: personal data can make services more relevant and businesses more efficient, while its collection can also create asymmetries users never knowingly chose. That tension is not resolved by calling tracking useful or harmful in general. It depends on consent, purpose, retention, and the ability to opt out without losing essential services. Privacy-aware design can constrain short-term targeting while protecting the trust on which long-term products depend.
Choose a data career by the work you want to own
Three kinds of contribution. The book describes data implementers, who build technical solutions; data leaders, who align people and projects with business goals; and data entrepreneurs, who turn expertise into independent products or services. These are work preferences, not rigid job titles. Strong portfolios, domain knowledge, communication, and relationships can support movement between them.
Monetize with a path. A data business can sell implementation services, consulting, information products, or software subscriptions. Kam Lee’s example moves from marketing data science services toward a software product, after he clarified his target customers and packaged his expertise. The book recommends starting where capability and demand already meet, then building toward more scalable offers rather than assuming a software product is the best first step.
The career archetypes offer a useful alternative to treating data scientist as one uniform profession. They make visible the distinct rewards of craft, coordination, and ownership. Lee’s path also illustrates that technical skill alone does not create a market; positioning and customer understanding matter. The categories should remain flexible, however. Real jobs often combine implementation and leadership, and a person’s preferred role can change with experience and circumstance.
Analysis
This book is best understood as a field guide that joins technical literacy to organizational action. Its breadth is both its strength and its summarizing challenge: it moves from probability, Python, SQL, and clustering to marketing, ethics, careers, and project planning. The most coherent thread is not a particular algorithm. It is the insistence that data work earns value only when the organization can connect a real decision to usable data, appropriate methods, capable people, and a change in practice.
The most important contribution is its practical resistance to technology-first thinking. The cautionary Hadoop account, the distinction between BI, analytics, and machine learning, and the emphasis on assessing existing resources all point toward disciplined investment. The case studies make that principle tangible, while the project-planning method recognizes that data systems are sociotechnical: adoption, ownership, and process changes matter as much as code.
The book’s business orientation also creates a productive tension. Profit and efficiency provide measurable reasons to fund data work, yet they cannot settle whether an outcome is fair, privacy-preserving, or socially beneficial. The chapters on governance and AI ethics help widen the frame, though operationalizing those principles requires more than documentation. It requires affected people to have recourse, models to be monitored after deployment, and organizations to test whether gains are distributed fairly.
A further distinction worth preserving is prediction versus intervention. A model may forecast churn or identify a high-risk loan, but acting on that forecast changes the system being measured. The strongest projects therefore pair predictive accuracy with evidence about consequences: did the intervention help, for whom, at what cost, and compared with what alternative? The book supplies a broad toolkit and a disciplined path to implementation. Its deepest lesson is that technical competence becomes consequential only when paired with context, institutional judgment, and accountability.
Review Summary
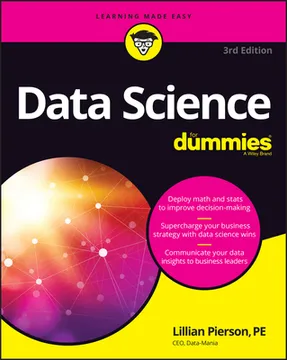
Reviews for Data Science For Dummies, 3rd Edition are mixed, averaging 3.4 out of 5. Many readers appreciate it as a broad introductory survey of data science concepts, praising its accessible language and real-world examples. However, common criticisms include repetitive content, excessive theory, and insufficient depth on practical topics like coding and machine learning. Several readers found it either too technical or too simplistic for their needs, with many noting it functions better as a starting point for further exploration than a standalone learning resource.
Glossary
Data science
Finding meaning in dataThe book defines data science as a multidisciplinary practice that uses mathematical and statistical methods, programming, and subject-matter expertise to discover insights from data and communicate them. In business, its purpose is to support decisions and improve outcomes, rather than simply produce models or reports.
Data engineering
Building data systemsData engineering is the work of designing and maintaining systems that capture, move, store, and process data. It addresses bottlenecks created by large volumes, rapid arrival, or varied formats. Its output is a usable data foundation from which analysts and data scientists can derive insights.
Big data
Data beyond conventional systemsThe book uses big data for data that exceeds the processing capacity of conventional database systems because of its volume, velocity, or variety. The term describes a technical challenge, not a guarantee of value. Raw big data often becomes useful only after aggregation, preparation, and analysis.
Data lake
Raw, varied data storageA data lake is a flat, nonhierarchical storage system for large volumes of raw data in multiple formats. Unlike a traditional data warehouse, which stores structured data for organized access, a lake can hold structured, semistructured, and unstructured records before they are prepared for particular uses.
STAR framework
Staged project-planning methodThe STAR framework is the book’s process for planning data science projects. It moves from surveying relevant use cases to examining a company’s resources, assessing feasible options, and recommending an implementation plan. Its purpose is to reduce costly technology-first decisions and identify projects that can produce useful business results.
POTI model
Organizational impact checklistThe POTI model organizes project assessment around four areas: processes, organization, technology, and information. It helps planners examine how a proposed data science project changes operations, roles and skills, technical systems, and data flows. The model can be used to evaluate both current conditions and implementation consequences.
Data superhero
Career-fit archetypeThe book’s term for the alignment between a person’s data skills and their personality, passions, goals, and priorities. It distinguishes three broad orientations: implementers who build solutions, leaders who guide projects and teams, and entrepreneurs who build businesses around data expertise.
Data storytelling
Narrative for decisionsData storytelling combines data visualization, selective context, words, and presentation to explain what findings mean for decision-makers. Unlike an exploratory display intended for analysts, it directs attention toward a clear interpretation or action. The story must remain faithful to the evidence rather than reshape it to suit an audience.
Data showcasing
Visual exploration for analystsData showcasing is a visualization approach for analytical audiences who want to inspect evidence and form their own conclusions. It typically provides more contextual information and less narrative direction than data storytelling. Its purpose is to make exploration easier without dictating a single interpretation.
Marketing mix modeling
Estimating marketing effectsMarketing mix modeling applies statistical and machine learning methods to historical sales and marketing data to estimate how product, price, place, and promotion relate to sales. Businesses can use the resulting relationships to forecast outcomes and adjust marketing plans. The method depends on suitable time-series data and careful interpretation.
Data governance
Rules for reliable dataData governance consists of shared policies, definitions, roles, and processes that help an organization maintain data quality, consistency, and appropriate access. It supports trustworthy analysis by clarifying how data is created, documented, stored, and used. The book treats strong governance as a foundation for accountable and explainable AI.
Download PDF
Download EPUB
.epub digital book format is ideal for reading ebooks on phones, tablets, and e-readers.








