

Key Takeaways
Choose KPIs by asking what strategy needs answered, not what data already exist.
Start with the decision. Marr’s central warning is that organizations often measure what is convenient, then retrofit objectives to the numbers. Instead, define strategy, identify what managers need to know, and select measures that answer those questions. A Key Performance Question, or KPQ, is a management question that expresses a specific information need and guides the choice of a useful KPI. For example, asking whether a business creates value after paying for its capital points toward a different measure than asking whether sales are growing.
Build a balanced view. The book organizes measures across financial, customer, marketing and sales, operational, employee, and corporate responsibility perspectives. This is a menu, not a universal checklist. A telecom company and a hospital need different indicators, even when both use the same broad categories.
The strategy-first approach treats measurement as a design problem rather than a data-collection problem. That distinction matters because readily available data tend to become organizational priorities simply by appearing on dashboards. A useful test is whether a manager could make a different decision after seeing the KPI. If not, the metric may be descriptive decoration. The six perspectives also guard against a narrow financial view, though they do not guarantee balance by themselves. A dashboard can still contain dozens of measures, so disciplined selection and clear ownership remain essential.
Pair profit with cash and capital costs before declaring growth healthy.
Profit has blind spots. Net profit shows what remains after expenses and tax, while gross and operating margins help locate whether pressure comes from production costs or running the business. EBITDA excludes interest, taxes, depreciation, and amortization, which can aid comparisons, but it is not cash flow: it omits working-capital needs and equipment replacement. The cash conversion cycle tracks the days cash is tied up in inventory and customer payments, minus the time available to pay suppliers.
Charge for investment. Economic value added, or EVA, estimates profit after subtracting a charge for the capital used. In the book’s packaging-line example, an upgrade adds $2 million in after-tax operating profit but requires $7.5 million of capital. At an 11% capital cost, the investment creates $1.2 million of EVA, not the full $2 million.
These measures answer different questions, so disagreement among them can be informative. Revenue can rise while cash tightens; accounting profit can look positive while the business earns less than investors could earn elsewhere. EVA makes opportunity cost visible, but its adjustments and capital-cost estimates introduce judgment. It is strongest as a disciplined comparison of alternatives, not as an unquestionable score. Managers should also inspect whether cash-cycle improvements come from genuine process gains or from shifting payment pressure onto suppliers.
Judge customer loyalty by behavior, then ask whether those relationships pay.
Intent is not retention. The Net Promoter Score, or NPS, asks how likely customers are to recommend a company on a 0-to-10 scale. It subtracts the share of detractors from the share of promoters, producing a quick signal, not an explanation. Repeat purchases and contract renewals provide behavioral evidence, but the book warns that retention calculations must exclude newly acquired customers and count customers consistently.
Loyalty is not uniform value. One insurance-company analysis cited in the book found that 15-20% of customers generated all or more than all company profits, while less profitable customers offset some of those gains. Customer lifetime value estimates future revenue and costs from a relationship, helping decide how much to spend acquiring or retaining someone. But estimates depend on assumptions about customer lifespan, spending, and discount rates. Also, as many as 95% of dissatisfied customers may never complain, so silence is not proof of satisfaction.
The section’s strongest contribution is separating three ideas that are often collapsed: satisfaction, continued behavior, and economic value. A customer can recommend a brand yet leave, remain because switching is difficult, or buy frequently while costing more to serve than they generate. Combining survey signals with renewal records, complaint patterns, and profitability gives a more credible picture. There is a fairness question, too: segmenting customers by value can improve service economics, but it can also entrench unequal treatment. Measures should inform service design, not automatically justify abandoning low-margin people.
Track marketing from qualified lead to sale, not attention alone.
Count sales readiness. Cost per lead is useful only when paired with lead quality and eventual conversion. At a trade show, one exhibitor spent $12,250 to generate 31 sales-ready leads, or about $395 each. A larger competitor spent $76,000 and collected 1,110 leads, but only 71 were sales-ready, making each qualified lead about $1,070. The bigger crowd did not mean the better investment.
Follow the whole funnel. Website clicks, page views, search rankings, and social mentions can show whether people find and explore a brand, but they are intermediate signals. Conversion rates reveal how many visitors complete a desired action. Market growth and relative market share add context about whether the company is gaining ground in a worthwhile market. Brand equity matters too, but its value should be checked against customer perceptions, pricing power, and actual purchases.
The funnel perspective prevents a familiar analytical mistake: treating activity as impact. A campaign can create inexpensive leads that rarely become customers, while a costlier channel may attract fewer but better prospects. The correct denominator depends on the decision, so channel comparisons need consistent definitions of a qualified lead and a conversion. Digital metrics also need interpretation against the site’s purpose. A short visit can indicate failure on an online store, but success on a page that answers a question immediately. Context turns traffic statistics into evidence.
Fix the whole customer-facing process, not one efficient-looking step.
Follow work end to end. Order fulfilment cycle time measures the time from customer order to receipt. One example in the book describes a process redesigned from 18 days to four hours without extra labor or equipment, while cutting $400,000 in annual overtime and reducing inventory by $11.5 million. The improvement came largely from support activities such as order entry, scheduling, and quality control, not just factory machine time.
Expose hidden defects. First pass yield measures how many units complete a step without rework. In a four-step assembly example, yields of 95%, 96.8%, 95.6%, and 100% combine to an overall yield of only 87.9%. Measures such as delivery in full and on time, rework, downtime, and overall equipment effectiveness help locate losses. Lean process analysis also looks for unnecessary movement, waiting, excess inventory, defects, and other work that adds no customer value.
End-to-end measures challenge the tendency of departments to optimize their own boundaries while passing delays and costs downstream. The example also shows why bottlenecks often hide in administrative work that receives less attention than production. Composite measures such as overall equipment effectiveness can summarize availability, speed, and quality, but the component scores must remain visible. Otherwise, a better overall number can conceal a meaningful decline in quality. Improvement is more trustworthy when the customer outcome and the underlying process changes are both tracked.
Use project metrics to expose forecast risk, not to reward tidy reporting.
Look before the finish. Project schedule and cost variance compare actual performance with the plan, while earned value combines the budgeted value of completed work with spending and progress data to estimate whether a project is on course. The book cites the Standish Group’s estimates that 70% of projects exceed budget and that 52% finish at nearly twice their initial budget. These comparisons are most useful while there is still time to intervene, not merely as post-mortems.
Treat innovation as a portfolio of bets. Innovation pipeline strength estimates potential future revenue from projects in development, ideally with best- and worst-case scenarios. Return on innovation investment compares gains from new products or services with their development costs. Time to market can indicate speed, but shortening it by skipping testing risks recalls and damaged trust. These measures require explicit assumptions because future demand and project completion are uncertain.
Project measures become powerful when they improve forecasts rather than certify past performance. Earned value can reveal trouble early, yet its inputs depend on honest estimates of progress and work completed. That creates incentives to inflate completion or schedule easy tasks first. Innovation measures face a related challenge: optimistic revenue forecasts can make weak projects look attractive. Reporting ranges, assumptions, and milestone evidence is more informative than presenting a single precise figure. Speed is strategically valuable only when it does not quietly transfer risk to customers.
Measure employee commitment and retention, not workplace happiness alone.
Satisfaction is only a start. An employee may be content with pay and workload without feeling committed to the organization’s goals. Engagement measures attempt to capture that stronger connection. The book reports that Gallup estimated 73% of North American employees were disengaged in its 2007 results, and cites a three-year analysis of 40 global companies in which highly engaged firms had operating margins 5.75% higher than low-engagement firms. These are associations, not proof that survey scores alone cause better performance.
Pair attitudes with outcomes. Employee churn reveals how many people leave, while average tenure helps show how long they stay. Revenue per employee and human capital value added relate workforce size or costs to financial output, but comparisons must account for industry and business model. Training return on investment can trace a program from participant reaction through learning and workplace application to measurable business impact, then compare benefits with costs.
The employee perspective makes labor more than an expense line, but it also resists reducing people to productivity ratios. Engagement can plausibly support service quality and retention, yet survey results are shaped by trust, anonymity, and whether leaders act on feedback. Productivity measures can reward understaffing or short-term intensity if they are detached from quality and employee health. A credible system therefore pairs financial indicators with measures of experience and capability. The crucial operational question is not whether a score is high, but what workplace conditions produced it.
Count environmental impact across suppliers, products, and operations.
Trace impact beyond the factory. Carbon and water footprints include effects associated with operations and, where data permit, products and supply chains. A water footprint distinguishes rainwater used by crops, surface and groundwater consumed, and freshwater needed to absorb pollution. In a Coca-Cola assessment of two orange juices, orange growing accounted for about 99% of the products’ measured water footprint, showing how a company’s largest impacts can sit far from its own facilities.
Measure what can change. Energy consumption, supply-chain miles, waste reduction, waste recycling, and product recycling help identify improvement opportunities. Nestlé’s cited conservation program identified more than 200 projects with annual savings of about 1.3 million gigajoules of energy, 88,000 tonnes of carbon emissions, and 1.9 million cubic meters of water. Targets should reflect the organization’s material impacts, and reported reductions need clear boundaries and credible verification.
Environmental metrics expand performance beyond the organization’s immediate financial boundary. That is especially important when suppliers or product use account for more impact than owned facilities. Yet a single footprint number can obscure local scarcity, different forms of pollution, or uncertainty in supply-chain data. Distance traveled, for example, is not itself a complete measure of transport emissions. The useful management move is to locate the largest impact, disclose how it is calculated, and connect the figure to an intervention. Otherwise, environmental reporting can become a polished inventory rather than a reduction plan.
Treat every KPI as evidence for discussion, never as a complete verdict.
Numbers need interpretation. The book repeatedly warns that a metric can look authoritative while depending on definitions and assumptions. ROI calculations change according to which costs and benefits are counted. NPS compresses a range of customer responses into three groups and cannot explain why customers scored as they did. A high equipment-effectiveness score can hide a tradeoff between availability and quality.
Watch the behavior a target creates. If workers are punished for reporting defects, recorded first pass yield can rise while real quality stays put. If staff know an absence score’s trigger point, they may try to stay just below it. The book recommends combining quantitative indicators with open feedback, operational inspection, and related measures. A KPI should direct attention toward a question, not replace the judgment needed to answer it.
This is the book’s essential safeguard against measurement becoming theater. In organizational settings, people respond to incentives, so a target can change the very behavior it is meant to observe. The result is not simply bad data; it can be a distorted system in which visible performance improves while the underlying purpose suffers. Multiple measures, transparent definitions, and room for qualitative evidence reduce that risk. They do add complexity, but the alternative is false simplicity. The best dashboard is not the one with the cleanest numbers. It is the one that helps people notice what the numbers leave out.
Analysis
Marr’s book is best understood as a field guide to managerial attention, not a claim that 75 numbers can capture an organization. Its most durable idea is procedural: begin with strategic questions, select evidence that can inform action, then interpret that evidence alongside the people and processes behind it. The six perspectives are useful because they resist the familiar collapse of performance into profit alone. Customer loyalty, employee capability, operational reliability, market position, and environmental impact can all shape long-term organizational health, even when their effects are not immediately visible in an income statement.
The book’s breadth is also its central limitation. A catalogue makes metrics accessible, but it can encourage a checklist mentality unless readers distinguish a KPI from a diagnostic measure, a forecast, or a contextual indicator. Revenue growth, retention, and employee engagement are not interchangeable kinds of evidence. Some describe past outcomes, some estimate future behavior, and some depend heavily on surveys or accounting choices. Their usefulness depends on stable definitions, relevant comparisons, and an explicit theory of how the measured activity connects to the desired result.
A modern measurement system should therefore treat each KPI as a hypothesis. If improving a measure is supposed to improve strategy, managers need to test whether that relationship holds, monitor counter-effects, and preserve the raw information that a summary score compresses. A sales target paired with margin and customer retention is harder to game than sales alone. An efficiency target paired with quality and employee outcomes is more complete than throughput alone. Such combinations are not merely a larger dashboard; they are safeguards against confusing local optimization with organizational success.
The book’s practical value lies less in prescribing a universal dashboard than in teaching managers to ask better questions, compare unlike signals, and keep measurement subordinate to judgment. Numbers can focus attention, but they cannot decide what matters or explain every consequence. The manager’s task is to make the metric answerable to strategy, and strategy answerable to human and environmental realities.
Review Summary
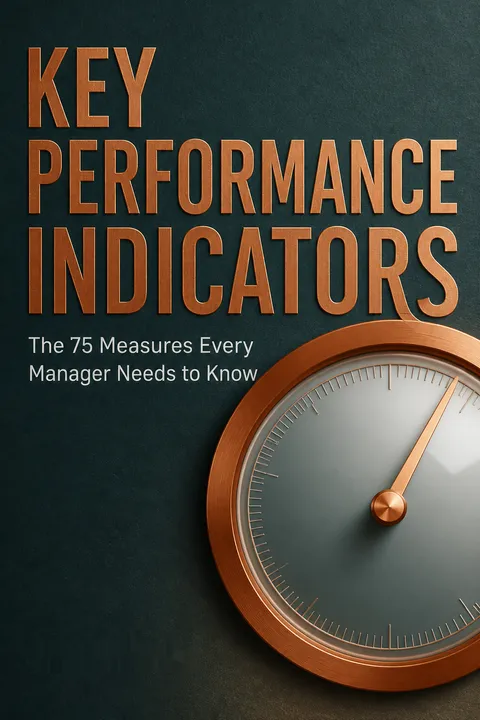
Key Performance Indicators (KPI) The 75 measures every manager needs to know receives mostly positive reviews, with readers praising its practical approach and comprehensive coverage of KPIs across various business areas. Many find it a valuable reference guide for managers and consultants. Readers appreciate the book's structure, clear explanations, and lack of fluff. Some highlight its usefulness for operations and as a desk reference. A few criticisms mention the book being too generic or lacking deep insights. Overall, reviewers find it a helpful resource for understanding and implementing KPIs in business.
People Also Read










Glossary
Key Performance Questions (KPQs)
Questions guiding metric choiceA Key Performance Question is a management question that states what decision-makers need to understand about strategy or performance. It is used to guide the selection of relevant KPIs, rather than beginning with whichever data are easiest to collect. A clearly framed question also gives a metric context when managers review results.
Economic value added (EVA)
Profit after capital costsEconomic value added estimates a company’s economic profit by subtracting a capital charge from net operating profit after tax. The capital charge reflects the funds tied up in the business, including debt and equity. EVA therefore asks whether operations earned more than the financing cost of the resources employed, rather than treating capital as free.
Cash conversion cycle (CCC)
Days cash stays tied upThe cash conversion cycle estimates how many days a company’s cash is committed to inventory and customer receivables before returning as collected cash, while accounting for time taken to pay suppliers. It is calculated from days inventory outstanding plus days sales outstanding minus days payable outstanding. A shorter cycle can support liquidity, but aggressive collection or delayed payment may damage relationships.
Net promoter score (NPS)
Recommendation-based loyalty scoreNet promoter score is calculated from customers’ answers to a recommendation question on a 0-to-10 scale. Scores of 9 or 10 are classified as promoters, 7 or 8 as passives, and 0 to 6 as detractors. The percentage of detractors is subtracted from the percentage of promoters. The result is a concise sentiment indicator, but it does not explain customers’ reasons.
Customer lifetime value
Projected value of a relationshipCustomer lifetime value estimates the present value of future financial contributions from a customer relationship. Models commonly include expected customer spending, contribution margin, retention or churn, retention costs, a discount rate, and a defined forecast horizon. The estimate can guide acquisition and service investment, but it depends on assumptions about future behavior and should not be mistaken for a certain outcome.
DMAIC
Five-step process improvement methodDMAIC is the improvement sequence used in Six Sigma: Define customer requirements, Measure current performance, Analyse causes of defects, Improve the process, and Control the gains. It organizes process improvement around evidence and customer specifications. Teams use it to identify where errors arise, test changes, and establish controls that help keep the improved process from slipping back.
Earned value (EV) metric
Budgeted value of completed workEarned value is a project-control measure that compares the budgeted value of completed work with planned work and actual spending. It helps managers assess progress at a particular point and estimate likely final cost if current performance continues. Its reliability depends on credible schedules, cost records, and honest estimates of how much work is actually complete.
Overall equipment effectiveness (OEE)
Combined equipment performance measureOverall equipment effectiveness combines equipment availability, operating performance, and output quality into one measure. Availability reflects operating time against planned production time, performance compares actual speed with an ideal cycle, and quality tracks good units against total units. The composite can highlight improvement opportunities, but its component scores should also be examined because the overall figure can conceal tradeoffs.
Absenteeism Bradford factor
Short-absence pattern indicatorThe Bradford factor weights repeated short absences more heavily than a single absence of the same total duration. It is calculated by multiplying the number of absence episodes squared by the total number of days absent over a chosen period. The score is intended to trigger review of disruptive absence patterns, not to determine automatically whether an employee has a valid reason or deserves discipline.
FAQ
What's Key Performance Indicators: The 75 Measures Every Manager Needs to Know about?
- Comprehensive Guide: The book by Bernard Marr is a detailed guide on key performance indicators (KPIs) that managers can use to measure and manage business performance effectively.
- Structured Approach: It categorizes KPIs into six perspectives: Financial, Customer, Marketing and Sales, Operational Processes and Supply Chain, Employee, and Corporate Social Responsibility.
- Practical Guidance: Each KPI is explained with its importance, measurement methods, data collection, target setting, and practical examples.
Why should I read Key Performance Indicators: The 75 Measures Every Manager Needs to Know?
- Enhance Decision-Making: The book equips managers with the knowledge to select and implement the right KPIs, improving decision-making capabilities.
- Avoid Data Overload: It helps managers focus on the most critical metrics, avoiding the common pitfall of drowning in irrelevant data.
- Expert Insights: Authored by Bernard Marr, a leading authority on organizational performance, the book offers insights backed by extensive research and real-world applications.
What are the key takeaways of Key Performance Indicators: The 75 Measures Every Manager Needs to Know?
- Importance of Measurement: Emphasizes that "What gets measured gets done," highlighting the necessity of KPIs in driving performance.
- Link to Strategy: Stresses that KPIs should be aligned with business strategy, ensuring they measure what truly matters for organizational success.
- Diverse Applications: The KPIs presented can be adapted across various industries, making the book relevant for a wide range of managers and organizations.
How does Bernard Marr define KPIs in Key Performance Indicators?
- Vital Navigation Instruments: KPIs are defined as "the vital navigation instruments used by managers to understand whether their business is on a successful voyage."
- Measurement Tools: They help organizations track performance against strategic goals, ensuring informed decision-making.
- Focus on Critical Metrics: Encourages managers to identify and focus on the "vital few" KPIs that truly impact business performance.
What is the significance of the Financial perspective in KPIs according to Bernard Marr?
- Core Financial Health: Includes KPIs that measure the financial health of an organization, such as net profit and return on investment.
- Investor Insights: These metrics are crucial for investors and stakeholders to assess the profitability and sustainability of a business.
- Benchmarking Performance: Financial KPIs allow for benchmarking against industry standards, helping organizations identify areas for improvement.
How can I measure Net Profit according to Key Performance Indicators?
- Data Collection: Net profit is calculated using data from the income statement, specifically sales revenue minus total costs.
- Formula: The formula provided is: Net profit ($) = Sales revenue ($) − Total costs ($).
- Frequency of Measurement: It is typically measured monthly as part of the income statement preparation, allowing for timely insights into financial performance.
What is the Customer perspective in KPIs as discussed in Key Performance Indicators?
- Focus on Customer Satisfaction: Includes KPIs that measure customer satisfaction and loyalty, such as Net Promoter Score (NPS) and customer retention rate.
- Impact on Revenue: Understanding customer metrics is vital as satisfied customers are more likely to return and contribute to revenue growth.
- Strategic Alignment: These KPIs help organizations align their strategies with customer needs, ensuring they deliver value and enhance customer experiences.
What is the role of Employee perspective in KPIs according to Bernard Marr?
- Employee Engagement: Focuses on metrics that gauge employee satisfaction and engagement, which are critical for organizational success.
- Impact on Performance: Engaged employees are more productive and contribute positively to the company culture, directly impacting overall performance.
- Retention and Development: KPIs in this category help organizations identify areas for improvement in employee retention and development strategies.
How does Bernard Marr suggest using KPIs effectively in Key Performance Indicators?
- Align with Strategy: Advises that KPI development should start with the organization's strategy and objectives to ensure relevance.
- Continuous Monitoring: Emphasizes the importance of regularly reviewing and adjusting KPIs to reflect changes in business goals and market conditions.
- Engage Stakeholders: Involving stakeholders in the KPI selection process can enhance buy-in and ensure that the metrics chosen are meaningful and actionable.
What are some specific KPIs discussed in Key Performance Indicators?
- Customer Satisfaction Index: Measures how products or services meet customer expectations, crucial for retaining customers and driving loyalty.
- Employee Engagement Level: Assesses how committed employees are to the organization’s goals, impacting productivity and retention.
- Carbon Footprint: Quantifies the environmental impact of business operations, highlighting the importance of sustainability in modern business practices.
How does Bernard Marr suggest setting targets for KPIs in Key Performance Indicators?
- Benchmarking: Targets should be set based on historical performance data and industry benchmarks to ensure they are realistic and achievable.
- SMART Criteria: Targets should be Specific, Measurable, Achievable, Relevant, and Time-bound to provide clear guidance and focus.
- Regular Review: Advises that targets should be reviewed regularly to adapt to changing business conditions and ensure ongoing relevance.
What is the Bradford Factor and how is it used in Key Performance Indicators?
- Absenteeism Measurement: The Bradford Factor is a formula used to measure employee absenteeism, emphasizing the impact of frequent short-term absences.
- Calculation Method: It is calculated by multiplying the total number of days absent by the square of the number of absence episodes, highlighting disruptive patterns.
- Management Tool: This metric helps organizations identify employees whose absenteeism may require further investigation or intervention.
About the Author
Other books by Bernard Marr





Download PDF
Download EPUB
.epub digital book format is ideal for reading ebooks on phones, tablets, and e-readers.








