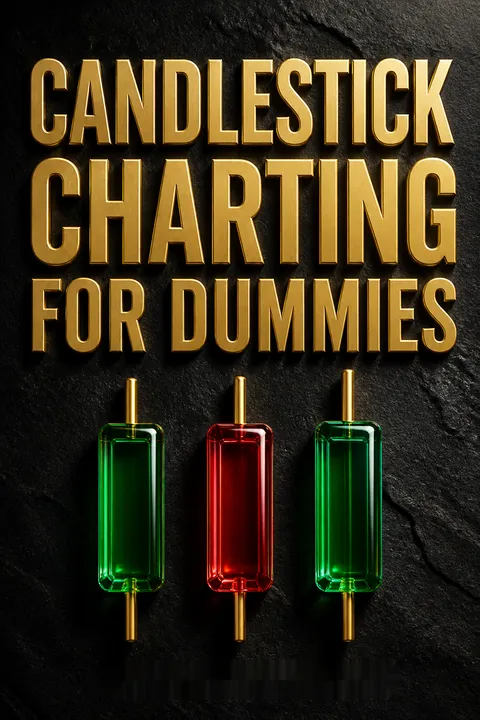


Key Takeaways
Read the candle as a four-price record, not a forecast.
Four prices, one picture. Each candlestick records a period’s open, high, low, and close. The thick body connects the open and close; the thin wick reaches the period’s high and low. A rising close is usually shown with a hollow or green body, and a falling close with a filled or red one. Together, these features reveal whether buyers or sellers dominated that period and how far prices moved before settling.
A candle can represent five minutes, a day, or a week. The chart is easier to scan than a line chart, which commonly shows only closing prices, and often clearer than a bar chart. But every candle depends on how the period is defined, especially when trading continues beyond official market hours.
Candlesticks work as a compact visual language: the body shows the open-to-close result, while the wick preserves the struggle that a closing-price line hides. That compression can help traders compare periods quickly, much as a dashboard turns many measurements into a readable display. Yet a clearer display is not stronger evidence of predictive power. Session boundaries matter too: a stock’s official opening price may omit meaningful premarket trading. The chart is therefore not a neutral photograph of the market. It is a summary shaped by choices about time, data, and display.
Judge every pattern against the trend that came before it.
Context changes the message. The book sorts markets into three broad states: rising, falling, or range-bound. A pattern that suggests a reversal only makes sense if a trend exists to reverse. For example, a hammer is a small body with a long lower wick. At the end of a decline, it is treated as potentially bullish; at the top of a rise, a similar shape is called a hanging man and is potentially bearish.
When the trend is unclear, the pattern’s meaning is unclear too. The author recommends skipping trades when chart readers cannot agree on the market’s direction. A trend can be judged by inspecting recent price movement or by using a trend line or moving average, but the chosen time frame matters.
This is a useful safeguard against treating shape as destiny. The same observation can mean different things in different systems, and the hammer versus hanging-man distinction makes that dependence visible. Context also forces a trader to state the time horizon: a daily chart may look bullish while a weekly chart remains weak. The limitation is that trend identification can be subjective, particularly when prices move sideways. Calling the market direction first, then selecting a pattern to fit it, can invite confirmation bias. A written rule for defining a trend makes the interpretation more repeatable.
Use candle shapes to read pressure, not to claim certainty.
Patterns describe a contest. A long white candle, with most of its range between the open and close, suggests buyers pushed prices up through the period. A long black candle suggests sellers drove prices down. A doji forms when the open and close are equal or very close, so the period ends near where it began despite the trading in between. Its meaning depends on where it appears and where its body sits on the wick.
A dragonfly doji opens and closes near the high after trading lower, suggesting buyers recovered from an early decline. A gravestone doji opens and closes near the low after prices rose, suggesting sellers erased the advance. These are clues about pressure, not promises about the next move.
The psychological reading is strongest when translated into observable behavior: prices fell, buyers appeared, and the close recovered. That is more disciplined than imagining that a chart reveals what every trader was thinking. A candle records aggregate transactions, not individual motives, and the same shape can emerge from very different news or liquidity conditions. This distinction matters because a persuasive story about a pattern can feel like proof. The useful question is narrower: what price levels were defended or surrendered, and what would show that interpretation was wrong?
Let a signal's failure level decide when the trade is over.
Plan the exit first. A pattern is useful only if the trader knows what would invalidate it. After a long white candle, the low may act as support; a break below it weakens the bullish case. After a long black candle, the high may act as resistance; a move above it weakens the bearish case. The author recommends placing a stop order at a chosen failure level so that a small loss does not quietly grow into a large one.
The right level varies by pattern and trader. A stop placed too close can be triggered by ordinary price noise; one placed too far away can expose the account to a larger loss. Some patterns may also fail through lack of follow-through, making a time-based exit relevant.
This turns chart reading into a decision process rather than a string of predictions. A stop level is a precommitted answer to the question, what evidence would change the trade thesis? That resembles a falsifiable hypothesis: the trader states what would count against the idea before being emotionally invested. Stops do not guarantee a precise exit, especially when prices gap through a chosen level, but they make risk visible and constrain indecision. The deeper discipline is not finding a perfect stop. It is sizing a position so that a plausible failure does not threaten the trader’s broader financial stability.
Watch multi-day patterns for control to shift, not names to memorize.
Several sessions tell a fuller story. In a bullish engulfing pattern, a rising second candle overtakes the preceding falling candle’s range, suggesting buyers have reversed the prior day’s selling. A bullish harami is the opposite kind of clue: a smaller session sits inside the range of a larger falling candle, signaling that selling may be losing force. Three-day patterns add more evidence. A morning star, for instance, moves from a strong decline to a small, uncertain session, then to a strong rise.
Other formations describe continuation rather than reversal. The three white soldiers pattern consists of three rising sessions and may signal a change from decline to advance. The book presents successful and failed chart examples for each, because a familiar pattern can still lead nowhere.
The most memorable way to learn these formations is as sequences of changing control. A reversal pattern is not just a set of shapes; it is a proposed account of how one side lost momentum and the other took over. That perspective can reduce dependence on memorizing a crowded catalogue of Japanese names. However, the large number of possible formations creates a testing problem: if enough shapes are searched, some will appear to predict price moves by chance. Pattern recognition is most useful when definitions are explicit and results are checked across many examples, not just memorable charts.
Wait for confirmation when a pattern's rules call for it.
A small delay can filter noise. The hammer and hanging man have similar shapes, but the book asks traders to wait for the next session’s opening move before treating them as confirmed signals. A hammer at the bottom of a decline needs a higher next open; a hanging man at the top of a rise needs a lower one. The bullish inverted hammer also calls for a higher opening on the following day to support the buy interpretation.
Confirmation can prevent an early entry when a pattern fails immediately. It is not free: a trader who waits may buy or sell at a less favorable price, and confirmation can itself prove false. The point is not to demand confirmation for every pattern, but to follow the rule attached to the pattern being used.
Confirmation makes the trade-off between speed and evidence explicit. In statistics, waiting for another observation can reduce the influence of a single noisy measurement, but the additional observation does not eliminate uncertainty. In markets, confirmation also changes the price at which a position can be entered, so the benefit must be weighed against the cost. A disciplined trader can compare a confirmed-entry rule with an earlier-entry rule using the same data and exit assumptions. Without that comparison, confirmation risks becoming a comforting ritual rather than a demonstrated improvement.
Pair candle signals with trend and momentum tools, not clutter.
Seek independent clues. Trend lines and moving averages help describe direction. A price above a moving average, or a shorter moving average above a longer one, is commonly read as evidence of an uptrend; the reverse suggests a downtrend. The relative strength index, or RSI, measures recent upward moves against downward ones. The stochastic oscillator compares a close with a recent high-low range. Both can flag potentially overbought or oversold conditions, while Bollinger bands widen or narrow with price volatility.
The author’s practical approach is to look for agreement between a candlestick pattern and an indicator, especially when deciding whether to enter or exit. Common reference levels are 30 and 70 for RSI, and often 20 and 80 for stochastics in the book’s trading examples. A reading at an extreme alone is not a complete signal.
Combining tools can be valuable when each answers a different question: the candle suggests a possible change, while a trend measure tests whether the broader direction supports it. But several indicators often reuse the same underlying price data. Agreement among them may therefore be less independent than it looks, like asking three people who consulted the same source. A compact, preselected set of tools is usually easier to evaluate than a chart crowded with indicators. The key test is whether the combination improves decisions after costs and failed signals are counted.
Choose chart periods and sessions that match your actual trade.
The data window shapes the signal. A daily candle built from official exchange hours can omit significant trading before the open or after the close. That omission may distort its open, high, low, or close, particularly after earnings news or in markets that trade nearly around the clock. Futures charts can be especially sensitive to how a trader defines a trading session. The author contrasts a chart using only exchange-floor hours with one using broader electronic trading data, showing how much price movement the narrower view can miss.
Choose a chart interval that fits the planned holding period. A trader looking for a move over minutes needs different data from an investor studying weekly prices. Volume can add context for stocks; open interest, the number of outstanding futures contracts, serves a related role in futures analysis.
This is a reminder that measurement choices are part of the analysis, not mere setup. A candle generated from one session boundary can differ from a candle generated from another, even when both are technically correct. That makes reproducibility essential: traders should record the data source, session definition, and time interval used to identify a signal. Volume and open interest can add context, but neither automatically reveals why participants acted. The chart can show activity and price response; causal explanations require other information and should remain tentative.
Test rules, limit exposure, and respect the losing signals.
Treat trading as a process. Before risking money, write rules for entries, exits, stops, and the amount at risk. Paper trading, which means tracking hypothetical trades without placing them in a live account, can help a novice learn the mechanics and test an idea. The author notes that it does not reproduce the emotional pressure of real gains and losses. Any live test should use an amount small enough to be inconsequential to the trader’s finances.
Back-testing applies a set of trading rules to historical prices, but historical data can contain errors, and past performance does not ensure future results. Compare data sources when possible, keep a backup system, and avoid confusing a successful example with a reliable strategy. Candlesticks are a tool for organizing decisions, not a promise of profit.
The book’s strongest practical message is its refusal to hide losing examples. That choice counters a common teaching bias: memorable winners are easy to display, while failed signals and disciplined exits are less glamorous. Paper trading and back-testing can expose weak rules, but neither fully reproduces live execution, slippage, liquidity constraints, or emotional behavior. A strategy should be judged by its performance across many cases and realistic costs, not by a handful of clean charts. In that sense, the most valuable skill is not naming patterns. It is managing uncertainty without letting one trade become a wager on identity or hope.
Analysis
Candlestick charting is best understood as a visual grammar for compressing price data into a sequence of short narratives. The body shows whether a period ended above or below its opening price; the wick shows how far prices traveled before the close. Patterns then turn those observations into hypotheses about changing pressure. The book’s distinctive strength is that it teaches the hypothesis and the failure condition together. A bullish formation is not simply an invitation to buy; it comes with a price level, trend context, or confirmation rule that can invalidate the trade.
That pairing of interpretation and risk control is more defensible than the stronger suggestion that chart patterns reliably forecast markets. The book’s many examples establish that patterns occur and can precede useful moves. They do not, by themselves, establish how often a strategy succeeds across all occurrences, whether it beats a passive alternative, or whether profits survive transaction costs and missed fills. Retrospective charts are especially persuasive because the eye can select a pattern after seeing what followed. A robust test would define the pattern and exit rules in advance, examine a broad sample, and account for losses as carefully as wins.
There is also a structural tension in combining indicators. A candle, moving average, RSI, and stochastic oscillator may appear to confirm one another, yet all are derived largely from price history. Their agreement may add interpretive clarity without adding as much independent information as it seems. The practical value may therefore lie less in prediction than in standardization: traders can use a repeatable vocabulary to describe conditions, plan responses, and reduce improvised decisions. Read this book as a guide to building and testing rules, not as evidence that a chart can remove uncertainty or guarantee an edge.
Review Summary
Candlestick Charting For Dummies receives mixed reviews, with an overall rating of 3.81 out of 5. Readers appreciate its informative content and value for beginners and intermediate learners. However, some criticize typographical errors and inaccurate chart examples. The book is praised for its clear explanations of candlestick charting and technical analysis. It covers various topics, including pattern identification, market behavior prediction, and combining candlestick analysis with other indicators. Despite its flaws, many readers find it helpful in understanding the stock market and improving their trading strategies.
People Also Read







Glossary
Candlestick
Four-price displayA chart mark representing a period’s opening, highest, lowest, and closing prices. Its body shows the relationship between the open and close, while its wick marks the high and low. A candle can represent periods ranging from minutes to weeks. The display conveys more intraperiod information than a line chart that shows only closing prices.
Doji
Near-equal open and closeA candlestick in which the opening and closing prices are equal or very close. Its body is therefore very small, while its wick may show a wide range of trading during the period. A doji is commonly interpreted as indecision, but its potential bullish or bearish meaning depends on its shape, position, and the preceding market trend.
Harami
Smaller candle within larger candleA two-period candlestick formation in which the second candle’s body is smaller than, and sits within, the first candle’s body. A bullish harami is considered in a downtrend and may indicate that selling pressure is easing; a bearish harami is considered in an uptrend and may indicate weakening buying pressure. The pattern is suggestive, not conclusive.
Marubozu
Candle with little or no wickA candlestick with little or no wick at one or both ends, indicating that the open or close coincided with an extreme price for the period. A white marubozu is associated with strong upward movement from open to close; a black marubozu with strong downward movement. The book distinguishes the strict no-wick form from long candles that retain small wicks.
Relative strength index
Price-momentum oscillatorA momentum indicator that compares the magnitude of recent upward price changes with downward changes and expresses the result on a scale from 0 to 100. The book uses 30 and 70 as common oversold and overbought reference levels. Those levels are prompts for attention, not automatic buy or sell instructions; the author pairs them with patterns or other evidence.
Stochastic oscillator
Close within recent price rangeA momentum indicator comparing a security’s latest close with its high-low range over a selected number of periods. It is commonly displayed as fast and slow lines, whose relationship and crossovers may suggest shifts in direction. The book treats readings near the extremes as potentially overbought or oversold, while emphasizing that a crossover or candlestick signal can provide additional context.
Moving average
Average of recent closing pricesA line calculated from closing prices over a chosen number of periods. As each new period arrives, the calculation updates, so the average moves with recent price action. A trader may compare price with the average, or compare a shorter-period average with a longer one, to help classify a trend. The result depends on the selected period and calculation method.
Bollinger bands
Volatility-adjusted price bandsA chart indicator consisting of a moving average and upper and lower bands placed at distances based on price volatility, measured using standard deviation. When volatility rises, the bands spread; when it falls, they narrow. The book presents prices beyond the bands as possible overbought or oversold conditions, best interpreted alongside other evidence rather than as standalone trading commands.
Paper trading
Hypothetical trade trackingThe practice of recording trades without placing them in a live account. It allows a trader to learn a method and observe how its rules behave without risking capital. The book recommends it as a useful learning tool, while noting that hypothetical trades do not reproduce the emotional pressure of gaining or losing real money.
FAQ
What is "Candlestick Charting For Dummies" by Russell Rhoads about?
- Comprehensive candlestick guide: The book is a thorough introduction to candlestick charting, explaining how to read, interpret, and apply candlestick patterns for trading decisions.
- Covers all pattern types: It details single-stick, double-stick, and complex multi-stick patterns, showing how each signals market psychology and price action.
- Practical trading focus: Real-world examples from stocks, ETFs, futures, and cryptocurrencies illustrate how to use candlesticks in various markets.
- Emphasizes risk management: The author stresses the importance of stops, confirmation, and disciplined trading to avoid common pitfalls.
Why should I read "Candlestick Charting For Dummies" by Russell Rhoads?
- Beginner-friendly approach: The book assumes only basic chart knowledge, making it accessible for novices and those looking to refresh their skills.
- Combines theory and practice: It teaches not just pattern recognition, but also how to combine candlesticks with technical indicators for more reliable trading.
- Focus on real-world trading: Emphasizes risk management, trading rules, and recognizing pattern failures, which are crucial for consistent success.
- Avoids unrealistic promises: Rhoads is clear that candlestick charting is not a guaranteed profit method, but a tool for making informed decisions.
What are the key takeaways from "Candlestick Charting For Dummies" by Russell Rhoads?
- Pattern recognition is powerful: Learning to spot and interpret candlestick patterns can improve trade timing and decision-making.
- Context is crucial: Patterns must be read in the context of market trends and confirmed with other indicators to avoid false signals.
- Risk management is essential: Using stops, exits, and trading rules helps protect against losses and emotional decision-making.
- Technical analysis is valid: The book defends technical analysis as a serious, mathematically supported discipline, not just guesswork.
What are the basic components of a candlestick as explained by Russell Rhoads?
- Four price points: Each candlestick is built from the open, high, low, and close prices for a specific period.
- Body and wicks: The open and close form the candle’s body, while the high and low create the wicks (shadows), showing price extremes.
- Color signals sentiment: Bullish candles (white/green) indicate a higher close than open; bearish candles (black/red) show a lower close.
- Visualizes market psychology: The shape and color of the candlestick quickly reveal who controlled the market during that period.
How does "Candlestick Charting For Dummies" by Russell Rhoads compare candlestick charts to other chart types?
- Superior visual clarity: Candlestick charts make it easy to see who dominated the trading day and the direction of the trend.
- More information than line/bar charts: Candlesticks display open, close, high, and low, while line charts only show closing prices and bar charts are less intuitive.
- Pattern recognition advantage: Candlestick charts feature distinct patterns that can signal buy, sell, or hold decisions, especially when combined with other indicators.
What are the most important single-stick candlestick patterns in "Candlestick Charting For Dummies"?
- Long white/black candles: Indicate strong bullish or bearish control, signaling potential trend continuation.
- Doji patterns: Dragonfly and gravestone dojis show indecision or potential reversals, depending on their position in a trend.
- Hammers and hanging man: Hammers at the bottom of a downtrend are bullish; hanging man at the top of an uptrend is bearish.
- Spinning tops: Represent market indecision and often precede reversals or pauses.
How does market context affect candlestick pattern interpretation in Russell Rhoads' method?
- Trend matters: The same pattern can have different meanings depending on whether the market is bullish, bearish, or range-bound.
- Confirmation is key: Many patterns require confirmation from the next day’s price action to validate the signal.
- Pattern location is critical: For example, a hammer is bullish at the bottom of a downtrend but not at the top.
- Avoid isolated signals: Patterns should not be traded in isolation; always consider the broader market environment.
What are the key double-stick and three-stick candlestick patterns in "Candlestick Charting For Dummies"?
- Double-stick patterns: Includes bullish/bearish engulfing, harami, doji star, piercing line, and meeting lines, which often signal reversals.
- Three-stick patterns: Covers three inside up/down, three outside up/down, morning star, evening star, three white soldiers, and three black crows for stronger trend signals.
- Continuation and reversal signals: Some patterns indicate trend continuation (tasuki gap, side-by-side lines), while others signal reversals.
- Pattern completion matters: The book advises waiting for the pattern to complete (usually by the close of the third day) before acting.
How does Russell Rhoads recommend combining technical indicators with candlestick patterns?
- Trend lines: Use trend lines to confirm market direction and identify support/resistance for better trade entries and exits.
- Moving averages: Combine simple, weighted, or exponential moving averages to define trends and generate signals.
- Momentum indicators: RSI and stochastic oscillators help spot overbought/oversold conditions and confirm candlestick signals.
- Bollinger Bands: Use these to gauge volatility and confirm overbought/oversold levels alongside candlestick patterns.
What risk management strategies does "Candlestick Charting For Dummies" by Russell Rhoads suggest?
- Use stop orders: Place stops below support or the low of the signal day to limit losses if a pattern fails.
- Exit failing trades quickly: The book emphasizes cutting losses early rather than holding onto losing positions.
- Develop trading rules: Create and stick to personal rules for entry, exit, and risk management to reduce emotional trading.
- Trend line and indicator-based stops: Use dynamic stops based on trend lines or indicator crossovers for more adaptive risk control.
What are common reasons candlestick patterns fail, according to Russell Rhoads, and how should traders respond?
- Strong prevailing trends: Patterns may fail during strong trends or momentum bursts, so use tighter stops and caution.
- Market noise and volatility: Stops placed too close to open/close can be triggered by small moves; use highs/lows of signal days for better protection.
- Lack of confirmation: Waiting for confirmation from the next day’s action or from indicators reduces false signals.
- Quickly exit failures: If a pattern fails, exit the trade promptly and move on to avoid larger losses.
How can readers start applying the methods from "Candlestick Charting For Dummies" by Russell Rhoads in their own trading?
- Master the basics first: Begin by learning to identify single-stick patterns and understanding market context.
- Combine with indicators: Use RSI, stochastics, moving averages, and trend lines to confirm candlestick signals and improve timing.
- Practice and back-test: Use real charts, paper trading, and back-testing to build confidence and understand pattern reliability.
- Prioritize risk management: Always use stops, be ready to exit failing trades, and avoid overanalyzing to prevent decision paralysis.
Download PDF
Download EPUB
.epub digital book format is ideal for reading ebooks on phones, tablets, and e-readers.








