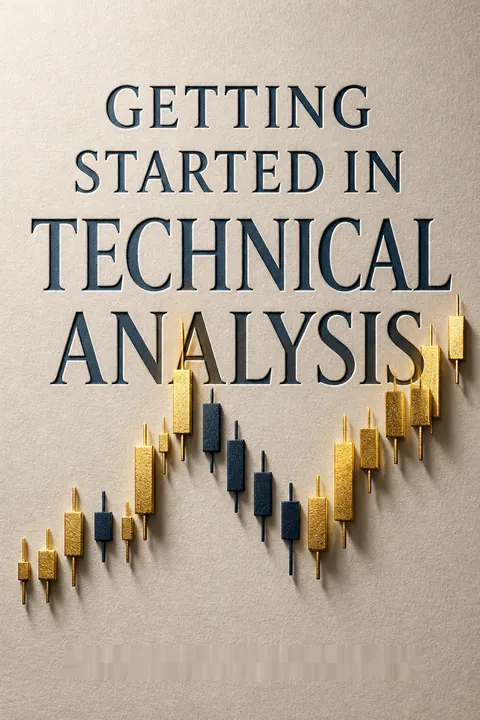


Key Takeaways
Use charts to read when market consensus shifts, not to explain why
Price records collective judgment. Fundamental analysis asks why an asset may be mispriced, using information such as company finances or crop reports. Technical analysis studies price behavior to judge when a move may begin, continue, or end. Its premise is that prices reflect what market participants know and believe, and that their interactions can produce recurring patterns.
Neither method wins universally. Jack Schwager contrasts Jim Rogers, who rejected chart reading, with Marty Schwartz, who attributed his success to technical trading. Their different records illustrate that traders can succeed with fundamentals, technical analysis, or a blend. Charts also have practical uses beyond forecasting: they summarize price history, show volatility, help time entries, and suggest risk points.
The useful distinction is between explanation and decision. A chart may show that buyers are gaining control without identifying the news, expectations, or constraints behind that shift. That makes it a compact behavioral record, not a complete account of value. Combining price evidence with fundamental reasoning can reduce the temptation to mistake a compelling story for a timely trade. Still, historical patterns are easy to select after the outcome is known. A chart-based hypothesis becomes more credible when its rules and risks are specified before the trade.
At new highs, test trend strength before reaching for a short
Price extremes can signal strength. A common novice instinct is to sell because a market has reached a new high. Schwager argues that a market capable of reaching and holding new highs may have powerful forces behind it, so fading that move can be dangerous. An uptrend is commonly identified by successive higher highs and higher lows; a downtrend by lower highs and lower lows. A break in that sequence is a warning, not proof, that the trend has reversed.
Use more than one lens. Daily charts can make a pullback look like a major top, while weekly or monthly charts show it against a much broader range. Trend lines offer another view, but are often broken and redrawn during a continuing trend. They are guides, not guarantees.
This lesson challenges the human preference for tidy reversals. A record price feels like an endpoint, but in a market it can also mean that previous sellers have been absorbed and new buyers are still willing to act. The practical safeguard is to distinguish a price that looks high from evidence that demand has weakened. Multiple time frames help with that distinction, although they can also invite cherry-picking: analysts may find whichever chart supports a prior opinion. A useful process states in advance which time frame governs the trade.
Treat support, resistance, and breakouts as zones needing confirmation
Ranges organize the chart. A trading range is a period when prices move sideways between approximate upper and lower boundaries. Those boundaries can act as resistance and support. After a sustained move above a range, its upper boundary may become support; after a move below, its lower boundary may become resistance. Prior highs, lows, and clusters of turning points can also mark areas where prices may stall or reverse. These are zones, not exact prices.
A first break can deceive. Longer, narrower ranges can produce more meaningful breakouts, but a brief move beyond the boundary may simply trigger clustered stop orders before prices return inside. Waiting for several closes, a minimum penetration, or another confirming pattern can filter some false signals. Confirmation may improve reliability, but it also means entering later and possibly missing part of a genuine move.
Support and resistance are best understood as areas where traders may coordinate their decisions, not as physical barriers in the market. That framing explains both their usefulness and their failure: many participants may watch the same level, yet their orders can be exhausted or overwhelmed. Schwager’s insistence on confirmation makes the trade-off explicit. A trader is not choosing between certainty and uncertainty, but between earlier, noisier evidence and later, more selective evidence. The right balance depends on the size of the expected move and the loss that can be tolerated.
Trade failed chart signals as evidence, not embarrassment
A failed signal can reverse the message. A failed signal occurs when prices do not follow through in the direction suggested by a chart pattern. For example, a bull trap is an upside breakout that quickly reverses; a bear trap is a downside break that rebounds. The failure can reveal that the move lacked underlying buying or selling support, making a trade in the opposite direction attractive.
Look for the failure, not just the pattern. Schwager applies this logic to breakouts, trend-line penetrations, gaps, and flags or pennants that break in the unexpected direction. A rapid return into a prior range can be especially telling. Yet the reversal needs a boundary: a trader can define confirmation through price retracement, time, or both, and specify what would invalidate the failed-signal interpretation.
This is a sharp shift from asking whether a forecast was right to asking what the market’s response reveals. In many decision settings, an unexpected failure is more informative than an expected success because it tests the assumptions beneath the initial signal. Here, the failed breakout suggests that apparent momentum did not attract follow-through. The idea also contains a risk: labeling every inconvenient move a trap after the fact makes the theory impossible to disprove. Predefined confirmation and invalidation rules turn an appealing narrative into a claim that can be evaluated.
Set the exit before entry, then size the position to the stop
Decide what proves the trade wrong. Schwager’s practical rule is to identify the exit point before opening a position. A stop can sit beyond a meaningful chart feature, such as the far side of a trading range, a recent relative high or low, or a flag boundary. If the nearest technical level implies too much risk, a money stop can cap the loss at a chosen dollar amount. A stop should not be moved farther away simply to avoid being stopped out.
Let risk determine size. The planned trading section recommends keeping maximum risk per trade at about 3% of account equity or less. The book’s trading psychology discussion gives a more conservative 1% to 2% guideline and cautions against risking more than 5%. Position size follows from the distance to the stop and the chosen risk limit, not from confidence alone.
A stop is not a prediction that the market must reverse at a particular price. It is a precommitment about how much evidence, or loss, is enough to abandon the idea. Connecting position size to stop distance prevents a wide technical stop from silently becoming a dangerously large bet. This resembles safety engineering, where exposure is designed around a failure threshold rather than optimism about normal operation. Stops do not eliminate gaps, poor execution, or repeated losses, so risk limits across correlated positions still matter.
Let strong trades breathe, and use trailing stops to protect gains
Good trades need room. A trader can be directionally right yet earn little by exiting at the first small profit. Schwager favors trailing stops for many profitable positions: raise the stop as a long position advances, or lower it as a short position declines. This lets the trade continue while progressively limiting the amount of open profit that can disappear. A stop tied too tightly to a pattern can force an early exit when the pattern shifts slightly or a brief price spike occurs.
Objectives are estimates. Measured moves project a possible target by matching one price swing to another, while support, resistance, and overbought or oversold indicators can suggest exit areas. These tools are more helpful in some conditions than others. Oscillator extremes may work in a range but can persist during a strong trend, so they should not automatically trigger an exit.
The tension is real: holding longer can capture a rare large move, but it also gives back more unrealized profit. A trailing stop makes that tension operational rather than philosophical. It protects some gains without pretending that the exact high or low can be identified in advance. The underlying logic resembles asymmetric payoff design: modest losses are accepted so that occasional large gains remain possible. But a trailing stop is not inherently wise at every distance. Its usefulness depends on the market’s volatility and on whether the trader can withstand the resulting drawdowns.
Enter established trends on pauses instead of chasing every breakout
A missed beginning is not a missed trade. Schwager warns against refusing to enter a strong trend merely because prices have already moved substantially. A trader can look for a partial retracement, a small countertrend reaction followed by renewed movement, or a continuation pattern such as a flag or pennant. A moving average can also help identify a pullback within a trend. Each method seeks a more manageable entry and a nearby point for exiting if the trend fails.
Add positions cautiously. Pyramiding means adding units to an existing position as the move continues. Schwager’s safeguards are practical: add only when the latest unit is profitable, avoid an added stop that would make the overall trade unacceptably risky, and keep each added unit no larger than the initial position. A market that never offers a pullback may keep rising, so waiting for a perfect entry can mean missing the move entirely.
This advice rejects the fantasy of perfect timing. An established trend can offer a better decision than an uncertain attempt to catch its exact beginning, provided the trader can define what would invalidate the trade. The same logic appears in staged investment and project commitments: add resources as evidence accumulates, but cap each additional exposure. The caution is that pullbacks can be signs of a genuine reversal rather than a pause. A reentry plan therefore needs a trend definition and a stop, not merely a hope that the previous direction resumes.
A system's value is consistency, not a dazzling backtest
Rules can restrain emotion. A mechanical trading system applies the same conditions to each signal, helping traders avoid selective participation, impulsive entries, and reluctance to exit losses. Schwager groups systems as trend-following, countertrend, or pattern-recognition approaches. Each has different weaknesses. Trend-following systems miss the beginning of moves and can suffer repeated whipsaws in sideways markets. Countertrend systems can lose heavily when a trend keeps going, unless they include loss limits.
Spread the risk. A system can also be diversified across markets, strategies, and parameter variations. The goal is not to own many versions for their own sake, but to reduce dependence on a single market or set of signals and improve the chance of participating in major moves. The approach must suit the trader: even a profitable system is unlikely to help if its drawdowns or pace make it impossible to follow consistently.
A system’s deepest benefit may be procedural rather than predictive: it makes behavior more repeatable. That matters because inconsistent execution can destroy the value of a sound method. Diversification strengthens the argument, since a portfolio can depend less on any one pattern or market. But mechanization does not remove judgment from trading. Someone must choose the rules, markets, position sizes, and acceptable drawdowns. The system relocates discretion; it does not abolish it. Its results should therefore be judged against a relevant benchmark and the real conditions under which it can be followed.
Test systems out of sample, with costs and realistic futures data
A spectacular backtest proves little. Schwager recounts a six-day moving-average method that appeared to earn a striking profit in Swiss francs in 1980. Tested across a longer period and 25 markets, it lost money in 19. The lesson is to distrust the handpicked market, year, and parameter set. Testing should cover varied conditions, include commissions and slippage, and account for trades that cannot be executed at the assumed price. The book suggests roughly 10 to 20 years for many tests, with shorter periods for short-term systems.
Keep testing separate from tuning. Optimization selects parameters that performed best in past data, which can make random historical quirks look like durable edges. Schwager recommends blind simulation: choose parameters using earlier data, then test them on a later, separate period. Another option is to average results across every parameter set tested, not just profitable ones. For futures, continuous futures data better represents price swings and account equity across contract rollovers.
This section treats backtesting as an exercise in guarding against self-deception. The more choices a designer makes after inspecting results, the easier it becomes to fit the past rather than discover a repeatable relationship. Separating development data from test data is a basic form of intellectual hygiene: the test should be capable of disappointing its creator. Realistic transaction costs and execution constraints matter for the same reason. Even disciplined testing cannot guarantee future performance, but it can expose strategies whose apparent edge depends on hindsight or favorable assumptions.
Build a personal trading process and audit your own mistakes
A plan joins method to behavior. Schwager’s trading plan asks the trader to define an approach, choose suitable and diversified markets, set risk rules, establish a review routine, and record decisions. A notebook tracks entries, stops, exposure, exits, and results. A diary records why a trade was taken and what happened, so hindsight does not rewrite the original reasoning. Reviewing results by market, trade type, or approach can reveal patterns that memory alone misses.
Fit matters. Successful traders in the book use markedly different methods and time frames. Schwager argues that a trading style should match the practitioner’s temperament, time, and tolerance for uncertainty. Patience, independence, and willingness to change a position when the evidence changes are recurring themes. Trading is not improved by constant activity: waiting for a clear opportunity and acting decisively when the original premise fails are both parts of the same discipline.
The notebook and diary convert trading from a stream of emotionally vivid episodes into evidence that can be reviewed. That is a modest but powerful form of personal science: record the prediction, the action, and the outcome before memory smooths over the mistakes. The emphasis on personal fit is equally important because discipline is easier to sustain when a method’s pace and drawdowns are tolerable. Still, introspection can reinforce a mistaken style if records are interpreted selectively. Regular review should test not only execution, but whether the method has an edge at all.
Analysis
Schwager’s book is less a catalogue of chart shapes than a manual for making decisions under uncertainty. Its progression moves from reading price data to managing trades, designing systems, testing claims, and examining the trader’s own conduct. The recurring thread is conditional reasoning: a chart pattern proposes a possibility, a confirmation condition tests it, and a stop identifies what would make the position untenable. This makes the book more practical than a forecast-driven account of technical analysis.
Its most distinctive contribution is the emphasis on failed signals. Rather than treating a failed breakout as an inconvenience, Schwager reads the market’s refusal to continue as information about the strength behind the original move. The idea is useful because it shifts attention from static pattern recognition to the sequence of market response. It also invites disciplined skepticism: a failure can only be informative if the original signal and its invalidation are defined clearly enough to avoid retrospective relabeling.
The book is candid about the limits of its own tools. Chart patterns involve interpretation, moving averages lag, oscillators can stay extreme in trends, and basic trading systems whipsaw in ranges. Its discussion of optimization is especially valuable because it explains why a beautiful historical result may be evidence of overfitting rather than skill. Yet the book’s many examples are primarily illustrative, not conclusive tests. They teach the reader what to inspect, but do not establish that a given pattern will produce an edge after costs in every market or era.
The strongest reading, then, is neither that charts reliably predict prices nor that they are useless. They provide a language for describing behavior, timing decisions, and controlling risk. Their value depends on whether a trader can turn subjective observations into explicit, testable rules, and whether the resulting approach can be followed when it loses. Schwager’s practical endpoint is not certainty. It is a process that can be challenged, adjusted, and survived.
Review Summary
Getting Started in Technical Analysis receives mixed reviews, with an average rating of 3.80/5. Readers appreciate its introduction to chart analysis and trading concepts for beginners. However, some criticize the book for being repetitive, lacking depth, and having poor chart quality. Critics argue it doesn't provide strong evidence for technical analysis effectiveness. Positive reviewers find it accessible and valuable for understanding chart patterns and indicators. The book is recommended for those new to technical analysis but may not satisfy experienced traders.
Glossary
Failed signal
A pattern that reversesA failed signal occurs when a market does not continue in the direction suggested by a chart event, such as a breakout, gap, or continuation pattern. Schwager treats the failure as potentially meaningful evidence for a move in the opposite direction. The interpretation needs confirmation and an invalidation point, since not every brief reversal becomes a durable trend change.
Continuous futures
A rollover-adjusted futures seriesA continuous futures series links successive futures contracts while adjusting for the price difference between them at rollover. This removes artificial gaps at contract transitions and represents price swings more faithfully than a nearest-futures series. Schwager recommends it for historical trading-system tests because its price changes correspond more closely to the equity changes of a position rolled from one contract into the next.
Blind simulation
Testing on later dataBlind simulation evaluates a system on data that was not used to choose its parameters. The system is developed or tuned on an earlier period, then tested on a separate, later period. Repeating this process across successive periods helps approximate the real decision a trader faces: selecting an approach using available history and then encountering new market data.
Slippage
Execution cost beyond commissionsSlippage is the difference between the price assumed in a hypothetical test and the price a trader could actually obtain. It can arise from poor fills, fast price movement, or futures markets locked at daily limits. A backtest that includes commissions but ignores slippage may substantially overstate the performance of an active system.
Optimization
Selecting best historical parametersOptimization searches parameter values, such as the length of a moving average, to find those that performed best on historical data. Schwager warns that selecting the best past result can fit a system to random quirks in that sample. He recommends looking for broad, stable areas of performance and testing selected parameters on separate data rather than trusting the top historical result.
Trend-following system
A system that follows price directionA trend-following system enters in the direction of a specified price move, on the assumption that the trend may continue. It necessarily enters after a move has begun and may surrender some profit before an opposite signal arrives. Faster versions respond sooner but can generate more false signals; slower versions may reduce whipsaws but react later.
Internal trend line
A line fitting most turning pointsAn internal trend line is drawn to approximate the majority of relative highs or lows, without giving special priority to the most extreme price points. Schwager argues that these lines can sometimes identify support or resistance more usefully than conventional lines anchored to extremes. Their placement is subjective, which makes them difficult to test consistently.
FAQ
What's Getting Started in Technical Analysis about?
- Comprehensive Introduction: The book offers a thorough introduction to technical analysis, focusing on its practical application in trading.
- Real-World Application: Author Jack D. Schwager shares insights from his trading experiences, bridging the gap between theory and practice.
- Structured Learning: It is organized into sections covering basic tools, trading systems, and practical guidelines, helping readers build their understanding progressively.
Why should I read Getting Started in Technical Analysis?
- Practical Insights: Schwager provides practical advice from a trader's perspective, making it valuable for real trading scenarios.
- Expert Guidance: As a respected figure in the trading community, Schwager's insights are backed by years of experience.
- Comprehensive Coverage: The book covers a wide range of topics, ensuring a well-rounded understanding of technical analysis.
What are the key takeaways of Getting Started in Technical Analysis?
- Chart Patterns: Recognizing and interpreting chart patterns like head and shoulders can signal potential price movements.
- Risk Management: Emphasizes setting stop-loss points and managing risk to minimize losses.
- Hybrid Approach: Advocates combining technical and fundamental analysis for a comprehensive market view.
What are the best quotes from Getting Started in Technical Analysis and what do they mean?
- "Common sense is not so common.": Highlights the counterintuitive nature of trading, urging reliance on analytical tools.
- "The market is like a flu virus.": Emphasizes market unpredictability, reminding traders to stay adaptable.
- "Nobody can catch all the fluctuations.": Encourages focusing on strategies and risk management over timing every trade.
What are the basic analysis tools discussed in Getting Started in Technical Analysis?
- Charts: Discusses bar, candlestick, and point-and-figure charts, each offering unique insights into price movements.
- Trends: Explains identifying trends through higher highs and lower lows, crucial for informed trading decisions.
- Support and Resistance: Highlights recognizing these levels as potential entry and exit points for trades.
How does Getting Started in Technical Analysis define trends?
- Uptrends and Downtrends: Uptrends have higher highs and lows, while downtrends have lower highs and lows.
- Trend Lines: Used to visually represent trends, connecting significant highs or lows.
- Trend Reversals: A trend is intact until a significant price point is broken, essential for strategy adjustments.
What are oscillators, and how are they used in Getting Started in Technical Analysis?
- Definition: Oscillators measure momentum and identify overbought or oversold conditions, like RSI and MACD.
- Market Extremes: Help spot potential reversal points by indicating when prices have moved too far in one direction.
- Divergence Signals: Divergences between price movements and oscillator readings can signal potential trend reversals.
What are some practical trading guidelines from Getting Started in Technical Analysis?
- Planned Trading Approach: Emphasizes having a structured trading plan with entry and exit strategies.
- Eighty-Two Trading Rules: Includes rules covering risk management and market behavior to guide decision-making.
- Market Wisdom: Shares insights from successful traders, highlighting the importance of learning from experience.
How does Getting Started in Technical Analysis address the debate between fundamental and technical analysis?
- Complementary Approaches: Argues both have merits and can be used together for enhanced market understanding.
- Market Behavior Focus: Technical analysis focuses on price behavior, while fundamental analysis looks at underlying reasons.
- Personal Preference: Traders should choose the approach that fits their personality and trading style.
What are the common pitfalls in technical analysis discussed in Getting Started in Technical Analysis?
- Over-Reliance on Indicators: Warns against blindly following indicators without considering broader market context.
- Ignoring Risk Management: Emphasizes the importance of effective risk management strategies to prevent significant losses.
- Emotional Trading: Highlights psychological challenges like fear and hope, advocating for discipline and a clear plan.
What is the significance of risk management in Getting Started in Technical Analysis?
- Protecting Capital: Crucial for preserving trading capital and ensuring long-term success.
- Setting Stop-Loss Orders: Important for automatically exiting losing trades to prevent significant losses.
- Adjusting Position Sizes: Discusses adjusting sizes based on market volatility and individual risk tolerance.
How does Getting Started in Technical Analysis suggest traders should approach their trading plans?
- Define a Trading Philosophy: Establish a clear philosophy outlining decision-making approaches.
- Choose Markets Wisely: Select markets aligning with strategies and risk tolerance, diversifying to reduce risk.
- Establish Risk Control Measures: Include strategies like setting maximum risk per trade and using stop-loss orders.
About the Author
Other books by Jack D. Schwager







Download PDF
Download EPUB
.epub digital book format is ideal for reading ebooks on phones, tablets, and e-readers.








