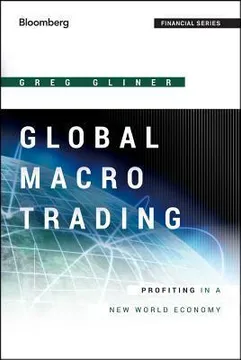


Key Takeaways
Trade the links between currencies, rates, stocks, and commodities, not isolated headlines.
Think in connected markets. Global macro trading uses economic conditions, policy decisions, and geopolitical events to take positions across currencies, equities, fixed income, and commodities. A view on one market can create implications elsewhere: faster US growth may lift company earnings, boost demand for industrial metals, and support commodity-linked currencies. The strategy’s flexibility also lets a trader take short positions, seek relative value, and look beyond any one country or asset class.
Map the chain of effects. The book describes risk-on periods as times when investors expect stronger growth and assets such as equities, copper, oil, and commodity currencies often rise together. Risk-off periods can reverse that pattern. These relationships are useful guides, not mechanical laws: a surprise rate cut, for example, can weaken a currency even as other risk assets rally.
What's distinctive is the book's insistence that a macro thesis should be translated across markets. This resembles systems thinking: a shock propagates through linked parts, and the best expression may not be the most obvious one. A currency can sometimes express a country's export exposure more cleanly than its stock index. Yet a map of connections is not a causal model. Correlations can shift when policy changes, so traders need to distinguish a durable economic link from a temporary market habit.
Size every position by volatility, portfolio overlap, and the loss you can survive.
Start with the downside. Position sizing determines how much a trade can hurt, not just how much it might earn. The book adapts a method associated with the Turtle Traders: calculate N, a 20-day exponential moving average of an asset’s true range, as a measure of its typical daily movement. Then use volatility-adjusted stops and size the position to a predetermined loss limit. Its example recommends considering a stop at 2N rather than 1N, to reduce the chance of being stopped out by ordinary price noise.
Count the whole portfolio. If several positions tend to move together, they can lose together. A stop also cannot prevent losses from a price gap, such as a sharp move between Friday’s close and Monday’s open. The book therefore pairs trade-level limits with correlation checks, stress tests, and predefined reductions in risk after losses.
This approach treats survival as a design constraint, a principle shared with engineering systems that must tolerate failure rather than assume it away. Volatility scaling also makes positions in unlike markets more comparable. But N and historical stress tests are estimates, not shields: volatility can jump, correlations can converge, and a market can open beyond a stop. The stronger lesson is layered control. Position limits, liquidity awareness, and scenario analysis each catch risks the others miss.
Treat back-tests as evidence about scenarios, not a forecast wearing a lab coat.
Ask a narrow question. A query tests how assets behaved around a defined historical event, such as a central bank decision. To make comparisons more meaningful, the trader should select similar past episodes and examine several outcomes: average returns, the share of positive and negative observations, and volatility. In the book’s example, a query of six Bank of England quantitative-easing announcements suggested that sterling tended to weaken soon after an announcement. The small sample and mixed performance across other assets show why a query cannot promise a profitable trade.
Compare like with like. An analog searches for a past period whose price pattern and economic setting resemble the present. A 2011 dollar episode was compared with a 2008 period that included the Bear Stearns collapse and Lehman bankruptcy. The resulting resemblance offered a possible roadmap, but not certainty. False positives remain possible, especially when the current regime differs from the historical one.
Historical tests are useful partly because they force a trader to state what would count as relevant evidence. That is a form of scientific discipline, even when the sample is too small for strong statistical conclusions. The danger is selection: a researcher can unconsciously choose the dates, assets, and analog that support a preferred story. Robust practice asks whether the result survives alternative windows, costs, and out-of-sample periods. A compelling chart is a hypothesis generator, not proof.
In a panic, correlations rise, so several trades can become one bet.
Look through the labels. A portfolio that appears diversified across equities, currencies, metals, and energy may still be making the same underlying wager on growth or investor confidence. The book calls the common pattern risk-on/risk-off: assets that benefit from stronger growth expectations often rise together, while the reverse can happen when fear takes hold. Its examples include the Canadian dollar’s historical relationship with WTI crude and copper’s relationship with the Chilean peso, reflecting their countries’ export exposure.
Stress the shared exposure. Correlations are not fixed. The book points to the 2008 financial crisis, when assets across different categories moved together under pressure. A trader long both the S&P 500 and copper might therefore be more exposed to a growth shock than either position suggests alone. Portfolio risk should be assessed across the combined positions, not just one ticker at a time.
This is a practical correction to the comforting idea that holding many instruments automatically creates diversification. In portfolio theory, diversification depends on how returns behave together, especially during the periods when protection matters most. A useful extension is to ask what economic driver each position needs in order to succeed. If several trades all require rising growth expectations, they may be separate instruments but one concentrated thesis. Correlation estimates still look backward, so stress scenarios should challenge them.
Blend human judgment with rules, but make both answer to measured risk.
Choose the method deliberately. The book distinguishes discretionary trading, systematic models, high-frequency trading, and commodity trading advisors, or CTAs. Discretionary traders use judgment to interpret economic and political information. Systematic traders use predefined rules and data. High-frequency strategies seek very short-lived price differences, while many CTAs use automated trend following. These approaches differ in speed, scale, and dependence on human decisions, but each needs a process for controlling risk.
Track what works. A trade journal should record the thesis, conviction, strategy, market, intended holding period, and result. Reviewing those records can expose patterns, such as strong performance in short-term commodity trades but weak performance in long-term fixed income. The book suggests combining discretionary and systematic approaches rather than assuming one is universally superior. Systematic strategies can be consistent, while human judgment can react to unusual conditions; each also has failure modes.
The useful contrast is not human versus machine, but explicit process versus unexamined discretion. Rules make decisions auditable, while judgment can incorporate context that a model does not encode. A hybrid approach can benefit from both, provided the discretionary override is itself reviewed rather than treated as special insight. The book also rightly emphasizes fit: a strategy that is theoretically elegant may still be unusable for a trader who cannot follow its drawdowns.
Let technical signals govern exits, while fundamentals explain what could move price.
Use charts as discipline. Technical analysis studies price movement, volume, positioning, and patterns to help identify trends, potential reversals, and trade exits. Moving averages can help classify a market as trending or countertrend; oscillators are generally more useful in range-bound conditions. The book also surveys chart patterns, seasonal tendencies, and tools such as Bollinger Bands. Their practical value is not that every pattern predicts correctly, but that a trader can define entry points, stops, and targets before emotion takes over.
Keep the limits visible. Technical analysis is contested. The efficient-market argument holds that past prices should not reliably predict future prices, while a pattern may also work partly because many traders respond to it. The book advises using tools in combination rather than treating an oscillator or chart formation as a standalone answer. A signal can guide a decision, but it does not explain the economic forces behind a move.
A chart can function as a behavioral commitment device: it makes the exit rule visible before a losing position becomes emotionally difficult to close. That is a meaningful use even if a pattern has weak predictive power. The distinction between decision usefulness and forecasting accuracy matters. A technical trigger may improve consistency without proving a market is intrinsically predictable. Conversely, indicators selected after seeing the data invite overfitting, so the method should be tested before it is trusted.
Before valuing a currency, learn whether its central bank lets it float.
Policy can override the model. Currency regimes range from fixed pegs to floating rates, with some central banks intervening frequently. A valuation model built for a freely moving currency can fail when authorities defend a target or use intervention to influence trade and inflation. Hong Kong’s dollar peg to the US dollar illustrates the trade-off: exchange-rate stability comes with less independent monetary control. Brazil’s real illustrates a different case, where policy makers have used taxes and foreign-exchange actions to manage currency pressures.
Combine several lenses. The book reviews purchasing power parity, trade balances, export exposure, economic growth, credit risk, and interest-rate carry as currency indicators. Purchasing power parity compares the prices of goods across countries, but the book notes that it is a weak short-term forecasting tool. Carry can earn interest-rate differentials, yet it can suffer sharp losses when markets turn risk-off.
The regime-first rule is powerful because it asks whether the market mechanism assumed by a model actually exists. This is an institutional question as much as an economic one. A peg is credible only within political and financial constraints, and intervention may delay rather than eliminate adjustment. Currency valuation also illustrates the gap between long-run anchors and short-run trading: a currency can look cheap for years while capital flows, rates, or policy dominate its price.
For commodities, track inventories and delivery timing as closely as headlines.
Follow physical scarcity. Commodity prices respond to supply and demand, shaped by reserves, production, weather, population, income, and industrial use. Ending stock measures inventory carried forward, which can cushion a shortage or reveal a tight market. Futures curves add information about timing. Contango means later-dated contracts cost more than near-term ones, often reflecting storage and financing costs. Backwardation means near-term contracts command a premium, often when immediate supply is scarce.
Know the market’s bottlenecks. The 2012 US drought damaged corn yields during a sensitive growing period, pushing prices higher. Oil traders, by contrast, must consider producers such as OPEC, shipping chokepoints such as the Strait of Hormuz, and regional pipeline capacity. A futures position also has its own carrying costs and roll effects, so a commodity fund or exchange-traded product may not track spot prices exactly over time.
The physical-market perspective keeps analysis grounded in constraints that financial charts can obscure. Inventory is not merely a statistic; it is a buffer between a shock and an actual shortage. Futures curves can reveal whether urgency is concentrated in immediate delivery or spread across time. Still, these signals are not transparent measures of scarcity alone: storage, financing, regulation, and hedging behavior also shape the curve. Traders need the contract mechanics as well as the headline supply story.
Read central bank balance sheets and votes as market-moving policy signals.
Follow the institution, not just the rate. Central banks influence markets through policy rates, asset purchases, lending facilities, reserve rules, and foreign-exchange intervention. At the zero lower bound, rate cuts may have little room to work, prompting unconventional steps such as quantitative easing, in which a central bank buys financial assets and creates reserves. The book describes how Federal Reserve and European Central Bank programs expanded during the financial crisis, affecting funding conditions and bond yields.
Interpret the disagreement. Meeting minutes can reveal whether policy makers are divided, and the direction of that division can matter before the next decision. In 2012, Bank of England votes shifted from a large majority against further asset purchases to a near split, before the bank approved additional purchases. The book also explains the impossible trinity: a country cannot simultaneously maintain a fixed exchange rate, free capital movement, and independent monetary policy.
Central banks are not simply background conditions; their balance sheets and communication alter the incentives facing investors and lenders. Minutes are valuable because policy is made by committees whose internal disagreement can signal a changing reaction function. Yet announcements are not the same as outcomes. Asset purchases may lower some yields without producing equivalent lending or growth, and market expectations can be priced in before a formal decision. The signal must be read against the institution’s constraints.
Use economic releases for timing, demographics for the long arc.
Separate fast signals from slow forces. GDP, inflation, employment, trade, government finances, consumption, and business surveys help assess the condition of an economy. A purchasing managers’ index above 50 generally indicates expanding activity, while a reading below 50 generally indicates contraction. Payroll data needs context: a falling unemployment rate can reflect people leaving the labor force, so participation and broader measures of underemployment matter too.
Look beyond the next release. Demographics affect labor supply, saving, public spending, and current accounts over decades. The book reports that from 1970 to 2012, the global population aged 65 and older grew by 180 percent, compared with 33 percent growth among those aged 0 to 14. Those figures illustrate why an aging population can strain public finances if fewer workers support more retirees. Demographic forecasts are slow-moving clues, not precise market-timing signals.
The useful distinction is between high-frequency information and structural change. Monthly data can move prices because it changes expectations; demographics matter by changing the economy’s capacity to produce, save, and finance obligations. This resembles the difference between weather and climate: the former shapes immediate decisions, while the latter alters the range of plausible outcomes. Both measures are noisy in their own way. Surveys can misread turning points, and demographic projections depend on assumptions about fertility, migration, and policy.
Value stocks against earnings and cash flow, but remember rates reprice everything.
Use several valuation measures. The book surveys price-to-earnings, price-to-book, dividend yield, free-cash-flow yield, and market capitalization relative to GDP. Each answers a different question, and none is a universal timing device. For example, a low price-to-free-cash-flow ratio may suggest a cheaper market, while earnings forecasts and debt can complicate comparisons between companies or countries. Equity indices also differ in construction and sector exposure, so an index return may reflect a small set of dominant companies.
Treat rates as the common yardstick. Fixed income yields influence the discount rate used to value future cash flows and affect currency carry. The fixed income landscape includes government bonds, money markets, swaps, and credit instruments. The book’s example of Japanese government bonds shows why high public debt alone does not determine yields: domestic demand and central bank activity can keep rates low despite concerns about debt sustainability.
Valuation ratios are most informative as comparative tools, not as clocks. A market can remain expensive or cheap for extended periods when rates, earnings expectations, or policy change. The discount-rate connection is especially important because it links bond markets to equity prices without making them move in lockstep. A careful analyst asks whether an apparent bargain is cheap relative to cash generation, financing costs, and risk, rather than relying on one historical average.
Analysis
Global Macro Trading is best understood as a practitioner’s field guide rather than a single predictive theory. Its organizing claim is that a macro investor should connect economic conditions and political events to positions across currencies, equities, fixed income, and commodities, while treating risk control as a central part of the craft. The book moves from trading process and strategy types to asset-class foundations, central banks, economic data, and demographics. That breadth is valuable, but it also makes compression difficult: a reference handbook contains many instruments and definitions, while its most transferable lessons are methodological.
The strongest through-line is disciplined uncertainty. A trader cannot know which forecast will be right, but can control position size, examine correlated exposures, study historical analogs, record decisions, and establish conditions for exiting. The book’s emphasis on journals and performance attribution is particularly practical because it turns a trader’s self-image into something testable. Its treatment of queries and analogs also shows both the promise and limitation of market history: past episodes can sharpen scenarios, but small samples and changing regimes prevent certainty.
A second strength is its cross-asset perspective. Commodity exporters, interest-rate differentials, central bank intervention, and sovereign credit link markets that conventional asset silos can hide. The text is strongest when it explains those mechanisms through concrete cases, from Black Wednesday to the 2012 US drought. Its technical-analysis survey is more encyclopedic than evidential, so the reader should distinguish a useful rule for managing a trade from a proven forecasting edge.
The book is rooted in the market environment of 2014, and many statistics, institutions, and policy examples are historical snapshots rather than current guidance. Its enduring value lies less in those dated details than in the questions it teaches readers to ask: What economic exposure does this trade represent? What can invalidate the thesis? How much can the portfolio lose if several assumptions fail together? Those questions turn a world-spanning strategy into a repeatable analytical practice.
Glossary
Global macro
Cross-market economic investingAn investment approach that uses economic conditions, policy, and geopolitical developments to take positions across markets and countries. The book focuses on four main groups: currencies, equities, fixed income, and commodities. Trades can express a directional view, such as expecting an asset to rise, or a relative-value view, such as expecting one bond market to outperform another.
N
Average true-range volatilityA volatility measure adapted from the Turtle Traders’ position-sizing method. N is the 20-day exponential moving average of true range, where true range accounts for the day’s high and low as well as gaps from the previous close. Traders use it to compare typical price movement across assets and to set volatility-adjusted position sizes or stops.
Query
Historical event comparisonA query examines how selected assets behaved around past occurrences of a defined event, such as a central bank rate decision or asset-purchase announcement. Results can include average returns, the frequency of gains and losses, and volatility over chosen time periods. A query helps assess possible outcomes and portfolio exposure, but past observations do not guarantee a similar future response.
Analog
Comparable historical price periodAn analog is a historical period selected because its price behavior and economic setting resemble the current market. Traders compare the two periods to develop a possible roadmap for future price action. The comparison becomes more meaningful when the economic environments are similar, but resemblance is not proof that events will repeat or that the future path will match.
Risk-on/risk-off
Shared market risk moodA broad pattern in which assets associated with stronger growth expectations tend to rise together during risk-on conditions, while selling pressure can spread across markets during risk-off conditions. Equities, industrial commodities, and commodity-linked currencies may share these moves. The pattern is a useful guide to common exposure, not a fixed relationship, because asset-specific news and policy can produce exceptions.
Risk premia
Compensation for bearing riskExpected returns associated with accepting particular risks beyond broad market exposure. Examples discussed in the book include currency carry and selling equity volatility. Such strategies may offer attractive long-run returns and can be incorporated into systematic portfolios, but they can also suffer large losses, especially during market stress or when many investors hold similar positions.
Risk parity
Balance portfolio risk contributionsA portfolio construction approach that allocates investments with the aim of balancing their contributions to overall risk, rather than assigning capital according to a fixed traditional split. The book contrasts this with a 60 percent equities and 40 percent bonds portfolio, whose risk can be dominated by equities. Risk-parity approaches may adjust holdings to target a more balanced or stable level of portfolio volatility.
Impossible Trinity
Three goals, choose twoA framework describing the limits facing a country’s monetary policy. A country cannot simultaneously maintain a fixed exchange rate, permit free movement of capital, and preserve an independent monetary policy. It can pursue two of these objectives, but doing so constrains the third. The framework helps explain why currency pegs can restrict a central bank’s ability to set rates for domestic conditions.
Contango and backwardation
Two futures-curve shapesContango describes a futures curve in which later-dated contracts cost more than near-term contracts, often reflecting storage and financing costs. Backwardation describes a curve in which near-term contracts cost more than later ones, which can occur when immediate supply is tight. The curve’s shape affects the economics of holding and rolling futures positions, in addition to signaling information about supply and demand.
Purchasing power parity
Compare prices across currenciesA currency valuation idea based on the expectation that exchange rates tend over time to reflect differences in the prices of comparable goods and services between countries. The Big Mac Index is a familiar illustration. The book presents purchasing power parity as a potentially useful long-term reference, while noting that it performs poorly as a short-term currency forecasting tool.
Download PDF
Download EPUB
.epub digital book format is ideal for reading ebooks on phones, tablets, and e-readers.








