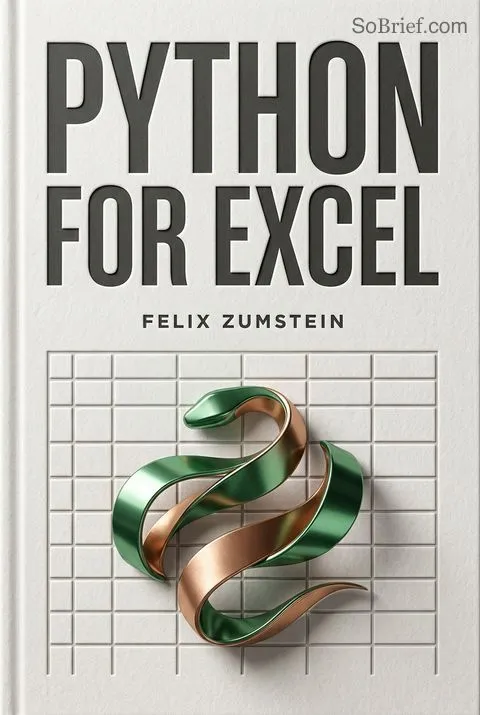


Key Takeaways
Treat mission-critical spreadsheets as software, then give them software-grade safeguards
Spreadsheet errors have consequences. The London Whale trading loss at JPMorgan was tied to a risk model spread across Excel sheets, manually updated through copy-and-paste, and weakened by a calculation that used a sum where an average belonged. Elsewhere, Excel turned a gene label into a date, while an older file format contributed to 16,000 COVID-19 test results being omitted from a report. The lesson is not that Excel is inherently dangerous. It is that complex spreadsheets are programs, even when their authors do not think of themselves as programmers.
Add safeguards deliberately. Separate inputs, calculations, and outputs; avoid duplicating logic; test important calculations automatically; and use version control to track and review changes. These practices make errors easier to catch before a workbook reaches a decision-maker.
What's striking is how ordinary spreadsheet features can combine into a fragile system: formulas, manual steps, and hidden assumptions all share the same surface. Treating a workbook as software encourages a shift from checking whether one result looks plausible to checking whether the process remains correct across inputs and edits. Still, formal controls should match the risk. A personal tracker does not need the governance of a trading model, but any spreadsheet that affects money, safety, or reporting deserves traceable changes and repeatable tests.
Keep Excel as the familiar front end; move repeatable data work into Python
Combine strengths, not loyalties. Excel remains a useful place for people to enter assumptions, inspect results, and share reports. Python adds a general-purpose language for automating tasks, obtaining and cleaning data, analysis, and visualization. That can replace the need to spread a workflow across Excel formulas, VBA, Power Query's M language, and Power Pivot's DAX.
Keep an exit route. Python skills and business logic can be reused beyond Excel, including in cloud computing or a web application. The book's point is not that every spreadsheet should disappear. It is that the calculations and data workflows do not have to remain trapped inside one workbook or one software ecosystem.
This is a pragmatic argument about interfaces as much as programming. Familiar tools lower the cost of adoption, while a separate computational core can make logic easier to test and reuse. The split also creates a new obligation: users need a reliable way to move data between the interface and the code. Python does not automatically make a workflow simpler if it adds installation, deployment, or support burdens that a team cannot manage. The best design preserves the user experience while making the machinery behind it more understandable.
Pick pandas, file libraries, or xlwings based on whether Excel must run
Choose the boundary first. For exploration and analysis, Jupyter notebooks combine code, notes, and charts. For scripts and larger projects, a code editor such as Visual Studio Code is more suitable. pandas handles tabular analysis and can read or write many Excel files without launching Excel. Lower-level reader and writer packages offer more control over file contents. xlwings automates the Excel application itself, so it requires Excel to be installed.
Respect the dependencies. File-based workflows run on Windows, macOS, and Linux. xlwings automation works on Windows and macOS, where Excel is available. Conda environments keep project-specific Python and package versions separate, reducing conflicts. The right choice depends on whether the task is data processing, workbook construction, or interaction with a live spreadsheet.
These are not interchangeable routes to the same result. The key design question is whether the application needs Excel's calculation engine and live interface, or only needs to manipulate a workbook file. That distinction affects operating-system support, deployment, and reliability. Separating experimentation from production code is useful too: notebooks make analysis visible, but hidden execution order can confuse readers. A script is less interactive, yet easier to run consistently. Tool choice is strongest when it follows the workflow rather than habit.
Let DataFrames replace formula chains with labeled, vectorized transformations
Think in tables, not cells. A pandas DataFrame is a two-dimensional table with named columns and an index; a Series is a labeled one-dimensional column or row. NumPy and pandas support vectorization, meaning an operation can apply across many values without a Python loop or copied cell formula. A single expression can calculate across entire columns, filter rows, group records, or create a pivoted summary.
Labels do useful work. When two DataFrames are combined or calculated together, pandas aligns values by their row and column labels. This can prevent accidental mismatches that are easy to create when copying formulas. But unmatched labels produce missing values, not Excel's implicit zeros. Inspect those gaps, then decide whether they represent missing information or should be treated as zero.
The move from cell coordinates to labeled data is more than a change in syntax. Labels make the meaning of a calculation easier to inspect, while vectorized operations reduce repetitive mechanics. Automatic alignment is a safeguard only when missing values are understood: a neat table containing NaN can still conceal an incomplete join or mismatched dates. The useful habit is to treat alignment as an explicit data-quality check, not as proof that two datasets correspond correctly.
Give timestamps an index before asking pandas to compare or resample them
Make time explicit. A DatetimeIndex is a DataFrame index made of timestamps. Once dates are parsed and sorted into one, pandas can select a period by its date string, account for time zones, and resample observations into a different frequency. The book uses Microsoft stock prices to show these operations: daily prices become log or simple returns, and several stocks can be aligned by date before comparing performance.
Change the time scale carefully. Resampling can turn daily prices into month-end observations, while a rolling window can calculate a moving average over a chosen number of observations. Time-zone conversion matters when comparing markets that report local closing times. These operations replace awkward row-to-row formulas, but their results still depend on choosing the right timestamp, interval, and aggregation rule.
Time series often fail through hidden calendar assumptions rather than difficult mathematics. A timestamp index makes the time dimension visible and gives analysis a consistent structure, while explicit time zones help distinguish a clock reading from a moment in time. Resampling also forces a useful question: should a monthly value be the final observation, the mean, or a sum? The code can execute any choice quickly. Only domain knowledge can determine whether that choice answers the question.
Use pandas for routine reports, then drop to writer libraries for polish
Automate the recurring pile. In the reporting example, Python searches folders containing monthly sales workbooks, reads both newer xlsx and legacy xls files, combines their rows, totals sales by store and date, and produces a monthly Excel report. pandas makes this workflow compact, including the pivot and aggregation, and does not need the Excel application to run.
Add detail when needed. pandas offers a convenient interface, but its basic Excel export cannot add a title or chart and provides limited control over formatting. OpenPyXL can read, write, and edit supported modern Excel files; XlsxWriter is a writer for new workbooks. pyxlsb reads binary xlsb files, while xlrd, xlwt, and xlutils cover older xls tasks. Start with pandas, then use a lower-level package when its added control matters.
The example shows the payoff of automating the pipeline, not merely speeding up a single export. Once the steps are encoded, the same process can be rerun without relying on someone to collect files and paste rows correctly. The tradeoff is a more fragmented package landscape, with different format support and APIs. That makes a small amount of documentation important: the next maintainer should know why a particular library was selected and what workbook features it can preserve.
Let xlwings preserve Excel's interface while Python owns business logic
Automate the live application. xlwings connects Python to Excel's object model: workbooks contain sheets, and sheets contain ranges and other objects. Python can read or write a DataFrame, call existing VBA, update charts, or place a plot into a workbook. A user can still work in a familiar spreadsheet while Python handles calculations and repetitive tasks.
Use templates and stable references. In the sales-report example, Python prepares the summary and xlwings inserts it into a formatted Excel template, autofits columns, and updates a chart. Named ranges can make code less dependent on fixed cell addresses. Because every call between Python and Excel takes time, transferring a whole range is generally more efficient than reading and writing cells one at a time.
xlwings is compelling when the workbook is not just a file but the interface people actively use. Templates preserve familiar formatting and controls, while named ranges reduce the brittleness of hard-coded coordinates. Yet automating a desktop application carries operational costs: Excel must be present, and unattended runs can be less stable than file-based processing. This makes xlwings a strong fit for interactive tools and template-driven work, but not automatically the best choice for every server-side reporting job.
Separate interface, logic, and storage before a workbook becomes an application
Give each layer a job. The Python Package Tracker uses Excel as its presentation layer, Python for business logic, and SQLite for storage. A user enters a package name, Python requests release information from PyPI, and the results are saved to a database and displayed in Excel. SQLAlchemy and pandas provide ways to query that stored data.
Plan for failure and change. Web requests can fail or take too long, so requests need timeouts and useful error handling. SQL queries should use parameterized inputs rather than inserting user text directly into query strings, which can expose an application to SQL injection. Keeping interface, processing, and storage separate makes the parts easier to change, although each connection between them must still be maintained.
This small application makes the book's architecture advice concrete: an Excel workbook can be a client of real services, not a container for every concern. The separation also clarifies where failures belong. A network timeout is different from a database error or invalid user input, so each deserves a distinct response. Modularity does not eliminate complexity; it moves complexity into interfaces between components. Clear contracts and informative error messages are what keep those seams manageable.
Make Python UDFs return whole arrays, not a thousand cell-by-cell calls
Bring functions into cells. A user-defined function, or UDF, is a Python function callable from an Excel formula through xlwings. UDFs can return pandas DataFrames, making it practical to replace a long formula or fetch outside data directly into a worksheet. In the Google Trends example, Python retrieves search-interest data and returns it as a table; another UDF creates a plot from that data.
Reduce repeated work. A single array formula can process a range at once, rather than calling Python separately from every cell. Excel's dynamic arrays spill a result into neighboring cells automatically. Older versions require fixed-size CSE arrays or an xlwings resizing option. For slow, deterministic requests, caching can reuse a result. UDFs are Windows-only in the book's setup, and the Google Trends connection relies on an unofficial package.
Array-oriented UDFs fit naturally with pandas, where calculations already operate on tables rather than isolated cells. They can also reduce the costly back-and-forth between Excel and Python. Caching is valuable when identical inputs should return identical results, but it becomes unsafe when data changes or the function has side effects. External services add another uncertainty: an unofficial interface can break without notice. The UDF design should therefore make both its inputs and its operational limits visible to users.
Analysis
Zumstein's central argument is a bridge, not a crusade against spreadsheets. Excel remains valuable because it is already embedded in business practice and gives users a flexible visual interface. Python supplies capabilities that Excel workbooks often lack: reusable code, a broad package ecosystem, efficient tabular analysis, and a path to computing beyond the desktop. The book's distinctive contribution is showing how to place these tools at different boundaries instead of forcing one to replace the other.
Its most useful organizing distinction is between analyzing data, editing workbook files, and automating the Excel application. pandas handles labeled data transformations; reader and writer packages manipulate files without Excel; xlwings controls Excel itself. These routes solve different problems and carry different deployment costs. Understanding that difference prevents a common mistake: selecting a library by familiarity, then discovering it cannot preserve a required feature or run in the target environment.
The examples also make a strong case that spreadsheet risk is architectural. The London Whale story is not merely a caution about formulas. Manual copying, hidden business logic, weak testing, and poor change tracking allowed an important model to become difficult to audit. Python can make separation, testing, and version control easier, but it does not guarantee correct results. A badly designed Python script can simply automate a bad assumption more efficiently.
The book's 2021 technical instructions are necessarily tied to versions of Python, Excel, and packages. Its durable value lies less in memorizing every command than in learning how to identify the right layer, make data movement explicit, test transformations, and plan for deployment. The most mature outcome is not an Excel-free workplace. It is a workflow in which users retain a practical interface while calculations and data processes become visible, reusable, and easier to verify.
Review Summary
Python for Excel receives positive reviews, with readers praising its practical approach to integrating Python with Excel. Reviewers appreciate the author's balanced presentation of various methods and the non-promotional tone. The book is commended for its clear writing and comprehensive overview of Python-Excel integration techniques. Some readers note issues with example files due to package updates since publication. Readers find the book valuable for learning Excel automation and data processing using Python, particularly highlighting the coverage of pandas and other useful packages.
Glossary
DataFrame
Labeled two-dimensional tableA pandas DataFrame is a two-dimensional data structure with labeled rows and columns. Unlike a NumPy array, its columns can contain different data types, and its labels help pandas align records during calculations and combinations. It is the book's main structure for cleaning, analyzing, summarizing, and exchanging tabular data.
Series
Labeled one-dimensional dataA pandas Series is a one-dimensional collection of values with an index. Selecting one column or row from a DataFrame commonly returns a Series. It resembles a one-dimensional NumPy array, but its labels support alignment with other pandas data and its name can preserve the identity of the selected column.
DatetimeIndex
Timestamp-based row indexA DatetimeIndex is a pandas index whose entries are timestamps. It lets a DataFrame represent observations along a time axis and supports selecting time periods, handling time zones, and resampling to another frequency. Parsing dates into this index is a foundational step in the book's time-series examples.
vectorization
Operations across whole arraysVectorization applies an operation across an array or table of values without explicitly writing a loop for each element. NumPy and pandas use this approach to express calculations compactly, such as adding a value to every entry or calculating returns across a time series. Their numerical operations can use compiled code beneath Python.
broadcasting
Automatic shape matchingBroadcasting is NumPy's mechanism for performing element-wise operations on arrays with compatible shapes. A smaller array or scalar is treated as if it extended across the larger array where the dimensions permit. This avoids manually copying values or writing loops, but incompatible shapes produce an error rather than a meaningful calculation.
data alignment
Matching values by labelsData alignment is pandas' behavior of matching values by row indices and column labels during operations between labeled data structures. It helps prevent calculations from pairing observations solely because they occupy the same position. If labels do not match, the result can contain missing values, so alignment must be checked rather than assumed correct.
xlwings
Python control for Excelxlwings is an open-source Python package for automating the Excel application on Windows and macOS. It follows Excel's object model, allowing Python to work with workbooks, sheets, ranges, charts, and other objects. It can connect Excel to Python scripts and user-defined functions, but requires a local Excel installation.
user-defined function (UDF)
Custom function callable in ExcelA user-defined function is a custom calculation that users call from an Excel cell formula, rather than selecting a built-in function such as SUM. With xlwings, Python functions can be imported into Excel as UDFs. They can accept cell values or ranges and return values, arrays, or DataFrames, subject to platform and Excel-version constraints.
dynamic arrays
Automatically expanding formula resultsDynamic arrays are an Excel feature that allows a formula to return multiple values into neighboring cells automatically. The resulting range adjusts to the dimensions of the returned data, which is useful when Python UDFs return tables whose size can change. Older Excel versions use fixed-size array formulas or xlwings resizing behavior instead.
Download PDF
Download EPUB
.epub digital book format is ideal for reading ebooks on phones, tablets, and e-readers.








