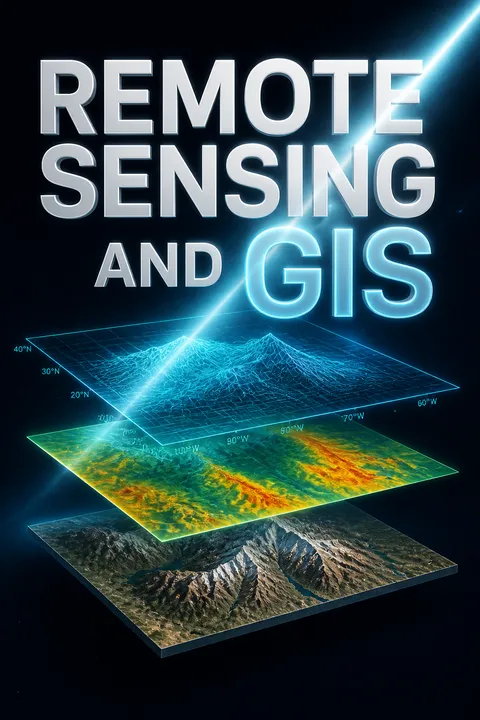


Key Takeaways
Treat every image as a measurement, not merely a picture.
Observation without contact. Remote sensing gathers information about objects without visiting or touching them. Most earth observation measures electromagnetic energy reflected or emitted by the surface. In a typical passive optical system, energy travels from the sun through the atmosphere, interacts with the ground, passes through the atmosphere again, and is recorded by a sensor. The data are then processed and interpreted before they can support a decision.
A changing viewpoint. Photography began in 1839, and Nadar photographed a French village from a balloon in 1858. Landsat 1, launched in 1972, helped make satellite imagery available to the public. The technology has changed dramatically, but an image is still only an observation. It does not explain itself, and its meaning depends on how it was measured and interpreted.
What's striking is how much interpretation sits between a physical surface and a claim about that surface. A sensor records energy, not labels such as forest, disease, or urban growth. Every step in the chain can add uncertainty, from atmospheric effects to processing choices. This makes remote sensing closer to instrument-based science than to taking a photograph: the image is evidence to be tested, not a transparent copy of reality. That distinction helps prevent confident-looking maps from being mistaken for direct observation.
Choose sensors by the question, then balance their four resolutions.
Match instrument to task. The four sensor resolutions are spatial, spectral, radiometric, and temporal. Spatial resolution describes the smallest feature detected; spectral resolution describes the wavelength bands measured; radiometric resolution describes sensitivity to brightness differences; temporal resolution describes how often an area is revisited. A temperature study needs thermal data, while mapping vegetation benefits from visible and infrared bands. Microwave sensors can collect data through many clouds and at night, unlike passive optical systems.
Coverage has a price. Satellites provide repeat coverage over large areas, aircraft can be scheduled for specific locations, and drones can capture imagery at roughly 1 to 3 cm resolution, though short flight times limit their coverage. These choices reflect a longer shift from balloon photography to digital sensors. India’s IRS-1A, launched in 1988, began an operational remote-sensing program that later included optical, radar, and cartographic satellites.
Resolution is not a simple ladder on which higher is always better. A fine pixel may reveal a small feature but cover less ground, while frequent revisits may matter more than detail when tracking a fast-changing event. The useful question is which uncertainty matters most for the decision: location, material identity, subtle energy differences, or timing. Treating sensor choice as a design decision, rather than a shopping contest, also makes trade-offs visible to the people who will use the resulting map.
Ground truth turns a plausible image reading into a defensible measurement.
Check the surface. Ground truth means observing, measuring, or collecting information about actual conditions on the ground so that image values can be related to real features. Field measurements can identify training areas for classification, check a sensor’s calibration, validate image products, or provide control points for geometric correction. A spectrometer can measure surface reflectance; a GNSS receiver can record the location of a field observation.
Match conditions and timing. Measurements are most useful when they correspond closely to image acquisition and record relevant conditions, including vegetation state, soil moisture, cloud cover, haze, sun angle, and topography. Ground truth is not automatically error-free: samples may miss variation within a large image pixel, and conditions can change between the field visit and the satellite pass. The aim is to connect a remote measurement to a credible, documented reference.
Ground truth is the bridge between remote observation and claims about the world, but it is also a sampling problem. A few convenient field sites may represent neither the full range of land-cover nor the mixed conditions inside coarse pixels. The strength of the comparison therefore depends on how samples are selected, when they are collected, and whether they are independent of the training data. Making these choices explicit improves both scientific credibility and practical trust in the resulting map.
Read signatures across bands and seasons, not colour alone.
Combine visual clues. Image interpretation uses location, size, shape, shadow, tone, colour, texture, pattern, height, and association. A spectral signature is the way a material reflects or emits energy across wavelengths. Healthy vegetation absorbs much red and blue light but reflects strongly in the near infrared; water usually appears dark in the near infrared. A false-colour composite can assign invisible infrared energy to a visible colour, revealing differences that a natural-colour image hides.
Use context. The same surface may look different as vegetation grows, soil dries, or viewing geometry changes. Radar images also require a different reading: bright returns often indicate rough surfaces or corner reflections, while smooth water commonly appears dark. Skilled analysts combine these clues with knowledge of the area. The book treats interpretation as a blend of scientific principles, technology, and human experience, not as automatic recognition.
A colour on a screen is an encoding choice, not an intrinsic property of the ground. That makes the book's insistence on combining spectral, spatial, and temporal clues especially valuable: a red patch in a false-colour image may signal healthy vegetation, while the same visible red elsewhere could mean something entirely different. The method also has limits. Similar materials can share signatures, and one material can vary with season or location. Reliable interpretation comes from converging evidence rather than a single striking pixel or hue.
Correct first, enhance second, classify last, then test the map.
Prepare before interpreting. Digital image processing begins with preprocessing. Radiometric correction addresses sensor and atmospheric effects; geometric correction aligns image locations with the ground or another image. A digital number, or DN, is a sensor-recorded pixel value, not automatically the surface reflectance. Converting DN values to radiance and reflectance, then correcting atmospheric effects, makes images more comparable.
Extract and verify. Enhancement adjusts contrast or sharpens features; transformations such as principal component analysis and vegetation indices reorganize information; classification assigns pixels to land-cover classes. Supervised classification learns from identified training areas, while unsupervised classification groups pixels by spectral similarity. Accuracy assessment compares the result with reference data, often using a confusion matrix and a Kappa statistic. A visually crisp output is not proof of an accurate classification.
The sequence matters because each operation changes what the next one can legitimately infer. Contrast enhancement can make features easier to see, but it cannot repair a bad geometric match or establish that a pixel represents the claimed class. Classification is best treated as a testable model of the image, with validation exposing where it fails. This also explains why an attractive map can be misleading: presentation quality and measurement quality are separate achievements.
Use GIS to ask where, what, what changed, and what if.
More than a map. A Geographic Information System links spatial features, such as roads or districts, to attribute data, such as road width or population. Its power lies in asking questions that combine location and description: what lies at a place, where conditions are met, what has changed, and what might happen under a proposed scenario. GIS can query databases, overlay layers, measure distances, trace networks, and analyse terrain.
Three useful views. GIS can be understood as a database view of linked information, a map view of geographic features, and a model view that transforms data to answer questions. For example, overlaying a road network with district boundaries can identify which roads fall in each district; network analysis can then examine routes or service areas. Remote sensing supplies observations, while GIS makes their spatial relationships available for analysis and planning.
The database, map, and model views are not competing definitions. Together they describe how geographic evidence moves from storage to interpretation to action. A map makes patterns visible, but a GIS can also ask whether those patterns satisfy a rule or how they relate to another layer. That capacity is powerful precisely because it depends on choices about categories, scale, and boundaries. A result is never just a property of the software; it also reflects how the world was represented.
Choose raster for continuous fields, vectors for distinct boundaries.
Fit representation to reality. Raster data divide space into cells, making them well suited to continuous surfaces such as elevation, temperature, and remotely sensed imagery. Vector data represent discrete features as points, lines, and polygons, such as wells, roads, and land parcels. A digital elevation model stores elevation values across a grid; a vector road network represents connected routes.
Relationships matter. Vector topology records how features connect, share boundaries, or sit within one another. Raster data are simpler for cell-by-cell overlays and surface calculations, while vector data preserve the identity and geometry of individual objects. Neither model is universally superior. Converting between them can lose detail or introduce errors, so the chosen model should match the question, the source data, and the analysis to be performed.
Raster and vector formats encode different ideas about what the world is. A raster treats space as a continuous field sampled into cells; a vector treats it as distinct objects with boundaries and relationships. That is more than a file-format decision. It affects whether a mixed pixel is acceptable, whether a road junction is explicitly connected, and how uncertainty appears in an analysis. Hybrid work is often necessary, but conversion should be treated as a consequential transformation rather than a neutral technical step.
Compare dates carefully, then model futures as scenarios, not certainties.
Separate change from noise. Land-cover describes what physically covers the ground; land-use describes how people use it. Change detection compares images or classified maps across time using methods such as subtraction, image ratios, principal components, and post-classification comparison. Apparent change can also come from atmospheric conditions, misregistration, season, sensor differences, or illumination, so matching dates and correcting images matter.
Errors compound. If each of two classified maps is 85% accurate, a direct comparison may be only about 72% accurate, because both dates can contribute error. Geosimulation uses models such as cellular automata, agent-based models, or neural networks to explore how spatial patterns might develop. These models support planning by making assumptions explicit, but their outputs are scenarios, not observations of a guaranteed future.
Change maps can look definitive while combining several sources of uncertainty: sensor differences, classification mistakes, and actual transformation on the ground. The example of 85% accurate maps yielding roughly 72% accurate comparisons makes the compounding problem concrete. Geosimulation adds another layer of inference, because rules and assumptions generate the future pattern. Its value is not prophecy; it is disciplined comparison of possible outcomes. Decision makers should ask which assumptions drive each scenario and whether the result changes when those assumptions change.
Build GIS as an institutional service, not a one-time software purchase.
Design the whole operation. A working GIS combines hardware, software, data, procedures, and users. Planning starts with organizational goals and information needs, then defines the system scope, database, products, costs, and implementation schedule. A team needs appropriate training, quality control, reporting, and clear communication. Metadata records what a dataset contains, how it was made, its quality, and its limits, helping users judge whether it fits their task.
Keep it useful. GIS data require maintenance, updates, and consistent standards; otherwise the system becomes a costly archive rather than a decision tool. Open data, web GIS, mobile mapping, and 3D visualization extend access and capability, but do not replace sound governance. The system succeeds when people can trust the data, understand the analysis, and use the results in actual planning and management.
The book's implementation guidance makes a crucial organizational point: technology does not create a functioning information service by itself. Data collection, metadata, training, maintenance, and communication determine whether a GIS remains useful after launch. This is especially important because maps can acquire institutional authority once they are embedded in routine decisions. Clear provenance and documented limits are therefore not administrative extras. They are safeguards against treating incomplete or outdated layers as unquestionable facts.
Analysis
The book's deepest contribution is its account of a chain of inference. Sensors measure energy, processing converts measurements into comparable data, interpretation assigns meaning, and GIS connects that meaning to decisions about places. Each link adds capability, but also assumptions. The central intellectual discipline is to keep those assumptions visible.
This perspective makes resolution more than a technical specification. Spatial, spectral, radiometric, and temporal resolution determine which differences can be observed and which will be blended, missed, or mistaken. Raster and vector models likewise encode different ideas about geographic reality: continuous fields sampled into cells, or discrete objects with boundaries and relations. Neither is neutral, and switching between them can alter what the analysis can detect.
The book also exposes a measurement problem that reaches beyond remote sensing. Classification converts complex surfaces into manageable categories, but categories are designed for a purpose. A land-cover map is not automatically a map of land-use, and an accuracy percentage can conceal unequal performance across classes. A strong workflow therefore treats validation, metadata, and ground observations as part of the evidence, not as optional finishing steps.
The same caution applies to prediction. Geosimulation can make assumptions about urban growth or other spatial change explicit and testable, but it cannot turn incomplete historical observations into certainty. Its best use is comparative: examine how different rules produce different plausible futures, then identify decisions that remain robust across them.
Finally, GIS is both analytical infrastructure and institutional practice. Shared data, standards, training, and maintenance determine whether the technical system supports cumulative knowledge or fragments into isolated projects. The book's movement from electromagnetic physics to databases and organizational planning is therefore coherent: trustworthy spatial decisions require not just better sensors, but a disciplined chain from observation to use.
Review Summary
Remote Sensing and GIS receives generally positive reviews, with an overall rating of 4.00 out of 5 stars based on 228 reviews. Readers describe it as an amazing and informative book, particularly useful for students. It is praised for its comprehensive content and effective layout. Some reviewers highlight its affordability compared to other textbooks. The book is considered a good resource for studying GIS fundamentals. While most comments are brief, they consistently express satisfaction with the book's quality and educational value.
Glossary
Remote sensing
Distant measurement of featuresThe acquisition of information about an object, area, or phenomenon without direct physical contact. In earth observation, sensors on aircraft, satellites, or other platforms measure electromagnetic energy reflected or emitted by the surface. The resulting data require processing and interpretation before they can answer questions about the landscape.
Ground truth
On-site reference observationsObservations, measurements, and records of actual conditions at the earth's surface, used to relate remotely sensed data to real features. Ground truth supports sensor calibration, image interpretation, training data selection, and accuracy assessment. It is a reference source, not error-free truth, because sampling and timing can affect what it represents.
Sensor resolutions
Four dimensions of sensor detailThe main characteristics used to describe an imaging sensor: spatial resolution concerns the smallest feature detectable; spectral resolution concerns the wavelength bands measured; radiometric resolution concerns sensitivity to differences in energy; and temporal resolution concerns how often the same area is imaged. These properties involve trade-offs and should be matched to the application.
Spectral signature
Energy response across wavelengthsThe pattern of reflectance or emission shown by a material across different wavelengths. Features can often be distinguished because their responses vary by band. Healthy vegetation, for example, absorbs much visible red energy and reflects strongly in the near infrared. Signatures also vary with season, location, and material condition.
Path radiance
Atmospheric energy reaching sensorRadiance that enters a sensor's field of view after interacting with the atmosphere rather than coming directly from the target area. Scattering and other atmospheric effects add this energy to the signal from the ground, introducing noise and complicating interpretation. Image processing may estimate and reduce its contribution.
Geographic Information System
System for geographic data analysisA computer-based system for capturing, storing, managing, analysing, and displaying geographically referenced data. A GIS links spatial features, such as roads or districts, to descriptive attributes, such as road width or population. Its distinctive capability is analysing relationships among locations and data layers.
Georeferencing
Linking image coordinates to earthThe process of assigning geographic coordinates to an image or dataset so it aligns with a reference coordinate system. Ground control points or known map locations help establish the transformation. Georeferencing allows spatial datasets to be compared, combined, and measured in a common geographic framework.
Digital Elevation Model
Grid of terrain heightsA digital representation of terrain elevation, commonly stored as a raster in which each cell contains a height value. DEMs support surface analysis such as slope, aspect, hillshade, watershed, and viewshed calculations. They can also be combined with imagery and other spatial data for mapping and visualization.
Topology
Recorded spatial relationshipsA way of representing relationships among spatial features, including connectivity, adjacency, and containment. In vector GIS, topology can record that roads connect at a node, polygons share a boundary, or one feature lies inside another. These relationships support network analysis, data validation, and spatial queries.
Change detection
Comparison of change over timeThe process of identifying differences in surface features or conditions by comparing remotely sensed data or maps from different dates. Methods include image subtraction, ratioing, spectral-temporal classification, and post-classification comparison. Results must be distinguished from apparent change caused by atmosphere, season, image alignment, or sensor differences.
Geosimulation
Simulation of spatial changeA modelling approach that uses geographic data and rules to explore how spatial patterns may develop over time. Methods discussed include cellular automata, agent-based models, and artificial neural networks. Geosimulation produces scenarios that depend on assumptions and rules; it does not guarantee a particular future.
Cellular automata
Neighbour-based spatial rulesA modelling method that divides space into cells and updates each cell's state according to rules involving its current state and neighbouring cells. In geographic applications, cells may represent land-cover classes, while transition rules represent conditions under which one class changes to another.
Object-based classification
Classifying groups of image pixelsAn image classification approach that first groups pixels into spatially coherent objects, then classifies those objects using spectral values and additional properties such as shape, texture, context, or proximity. It differs from pixel-based classification, which assigns a class to each pixel individually.
Download PDF
Download EPUB
.epub digital book format is ideal for reading ebooks on phones, tablets, and e-readers.








