

Key Takeaways
Treat slides as support for a human conversation
Slides are not the show. A presentation works through three connected parts: the message, the visual story that makes it graspable, and the speaker’s delivery. If one part dominates, the whole experience weakens. Text-heavy slides pull attention from the speaker; polished visuals cannot rescue an unclear point; energetic delivery cannot make irrelevant material matter.
The audience completes the system. Citrix CEO Mark Templeton described how learning to communicate vision helped him grow beyond managing tactics. He used drawings to make an abstract software business easier to understand. Duarte presents his story as evidence that slides should reinforce a speaker’s thinking, not substitute for it. The goal is not merely to show information, but to help people understand and act on it.
The three-part model resembles a system in which meaning emerges from interaction, rather than from any single component. Communication research often distinguishes the information transmitted from the relationship established between speaker and audience; the latter affects whether the former is trusted. Templeton’s drawings matter for this reason: they make an invisible product discussable. Still, charisma and design cannot guarantee agreement. A strong presentation earns attention and makes claims inspectable, while evidence, incentives, and organizational conditions determine whether people follow through.
Design around what your audience needs to do next
Start with their situation. Before making slides, identify who will be listening, why they are there, what troubles them, what might make them resist, and what action would help. An audience persona is a working portrait of a representative listener, including practical concerns and motivations. It is a planning tool, not a slide to project.
Make the benefit concrete. For a retirement investment seminar, the book profiles Ken and Kerry, a couple concerned about protecting savings while preserving an active lifestyle. Their concerns shape the presentation’s emphasis: risk, flexibility, and whether the proposal fits their lives. This prevents a presenter from mistaking product features for audience value. A clear call to action completes the work by telling listeners what they can do with the information.
Audience modeling is a useful antidote to the common expert bias of presenting what the speaker knows instead of what listeners need. It also resembles user-centered design, where a service is judged by whether it fits real circumstances, not by the elegance of its internal logic. Personas can become caricatures, however, especially when built from assumptions rather than interviews or observation. Their best use is as a set of hypotheses to test. The presenter should keep asking whose needs are missing and what evidence supports the imagined profile.
Generate ideas on paper before opening presentation software
Separate thinking from formatting. Presentation software is a container for ideas, not a reliable tool for discovering them. Start away from the screen with words, rough sketches, or a word map. Sticky notes help because each can hold one idea, then be rearranged as the argument develops. The point is to generate alternatives before choosing a visual solution.
Resist the first answer. A first sketch may be obvious without being effective. The book recommends exploring several possibilities, then testing promising ones with colleagues. In one example, an executive’s diagram looked like a single spiral, but discussion revealed a process that began in a line and then cycled. The team separated the stages across slides to make the logic clear. For a 30-slide, hour-long presentation, the book estimates 36 to 90 hours of development, including research, reviews, design, and rehearsal.
Moving ideation away from the software interrupts a powerful default: the blank slide invites premature layout decisions, which can make weak ideas feel finished. Sketches preserve reversibility, a valuable feature in any creative process. The advice to generate many options also counters fixation, the tendency to keep refining the first plausible answer. Yet collaboration is not automatically corrective. Groups can converge too quickly or reward familiar ideas. Independent sketches before discussion can protect variety, while audience testing can reveal whether the most original option is actually understandable.
Choose diagrams by the relationship you need people to see
Match shape to logic. A diagram should express how parts relate, not decorate an idea. A sequence needs a path with a beginning and end; a repeating cycle needs a loop; a hierarchy can use a tree; shared responsibilities may call for overlapping groups. The book sorts common diagrams into flow, structure, cluster, and radiating forms, then adds more literal pictures such as maps, process illustrations, and data displays.
Build complexity gradually. Software systems and other invisible concepts often need several diagram types combined. Rather than expose the entire construction at once, reveal its parts in a sequence so listeners can follow the connections. Bill McDonough uses live drawing to make complex charts easier to process one point at a time. A human figure or familiar object can also supply context, helping an abstract system feel connected to people’s work.
Diagrams act as compact models of a system: their geometry tells viewers what belongs together, what precedes what, and what carries more weight. That makes diagram choice a reasoning task, not merely a graphic one. In cognitive terms, a well-chosen visual can externalize relationships that are difficult to hold in working memory. The danger is false precision. A neat loop may imply a closed process where feedback is messy, and a tree may make authority look more fixed than it is. Visual simplicity should clarify the model without pretending the world is simpler.
Make each chart reveal a conclusion, not merely display figures
Lead with the meaning. Data slides should help the audience see why the numbers matter. Before choosing a chart, decide what listeners should conclude. Then select a form that makes that conclusion visible. A bar chart is often better than a pie chart when precise comparisons matter, while a single important number may deserve more space than a chart.
Protect trust. The book warns against distorted scales, decorative effects, and clutter that obscure the data. It illustrates how the same sales figures can tell different stories depending on the chosen emphasis. In one example, a human resources team wanted to show that a new training program coincided with a sales recovery after March. The timing was the point of the chart, but a presentation should not imply that timing alone proves causation. Provide the full data when audiences need to inspect it.
A chart is an argument because it selects a comparison, a time window, and a visual emphasis. Making that argument explicit improves comprehension and makes scrutiny possible. The caution about the training example is especially important: a visual can turn correlation into an apparent causal story without stating the leap in words. A responsible presenter distinguishes observed change from explanation and shows enough context for the audience to judge. Clarity and candor are complementary. Simplification earns trust when it removes noise, not when it removes inconvenient evidence.
Use layout to tell viewers what matters and where to look
Position creates meaning. Size, contrast, placement, and spacing tell viewers what is central, what supports it, and what to notice first. A slide with equal emphasis everywhere gives the audience no useful starting point. A clear visual hierarchy works like a map: it guides attention through the information in a purposeful order.
Leave room to think. Whitespace means unused space, not necessarily white space. It separates related ideas, prevents visual crowding, and gives important content room to register. When a slide contains too much, divide it into several slides and reveal the material in sequence. The book also recommends consistent grids, which keep comparable elements in stable positions across slides. Those repeated placements help viewers recognize a pattern instead of re-learning the layout each time.
Layout is a form of nonverbal syntax. Proximity implies relationship, size signals priority, and sequence shapes interpretation before a presenter explains anything. This is why visual clutter is not just unattractive: it imposes extra decoding work. The principles align with perceptual grouping, in which people naturally organize nearby or similar objects into units. Still, conventions vary across cultures, languages, and accessibility needs. A left-to-right flow may not be universal, and color alone should not carry essential meaning. Structure is strongest when its cues are both deliberate and redundant.
Build a consistent visual language, then break it sparingly
Make elements work together. Background, color, text, photographs, and illustrations form a visual system. A background should host the content rather than compete with it. A restrained palette can signal tone and distinguish primary from secondary information. The book suggests choosing a small set of core colors, checking contrast in projection, and testing whether distinctions remain visible without color alone.
Choose images with intent. Photos should feel like members of the same family, with compatible lighting and style, and should show believable situations rather than stock clichés. Typography also carries personality: the book recommends limiting a presentation to one or two typefaces and keeping text brief enough to scan. Consistency makes the deck feel coherent, while an intentional departure from the established look can create a memorable moment. If every slide breaks the pattern, none of them stands out.
A coherent visual system reduces needless variation, allowing attention to go toward meaning rather than constant changes in style. It also creates recognizable signals, much as interface design uses stable controls so users can focus on tasks. Accessibility belongs inside that system, not as a final check: the book notes that color vision deficiencies are common and recommends testing contrast and using distinguishable shapes as well as hues. Consistency should not become a straitjacket, though. A visual convention is useful only while it serves the message and the people receiving it.
Animate only when movement explains sequence, change, or cause
Motion captures attention. Because viewers instinctively notice movement, an animation can either direct attention or steal it. Use it when it helps explain a process, reveal a hidden part, show a change in relationship, or guide the audience through a sequence. Plan the motion as part of the story, rather than adding effects after the slides are complete.
Make the movement legible. A conservation presentation for Rare showed a local campaign unfolding through people entering and leaving a scene, turning a list of steps into a visible journey. The book also recounts a briefing where two of 20 executives closed their eyes during an overanimated presentation. That small example makes a practical point: movement can cause discomfort as well as distraction. If the audience must work to interpret the effect, the effect is not helping.
Animation is an attentional cue, and attention is a limited resource. Used with restraint, motion can externalize time and causality, qualities that static diagrams often struggle to show. The Rare example demonstrates how staging can make a process feel lived rather than merely enumerated. The risk is that visual salience is mistaken for importance: the most active element may become the most memorable, even when it is incidental. Motion should therefore be tested at the pace and scale of the actual presentation, with accessibility and viewer comfort treated as part of design.
Rehearse until your slides stop acting as a teleprompter
Own the story. When a slide carries paragraphs, audiences often read ahead while the presenter reads or explains the same text. Reducing the words forces the speaker to understand the argument and speak to the room. The book suggests practicing from a small number of keywords, recording a rehearsal, and repeatedly retelling the story until the slides are cues rather than a script.
Choose constraints for context. Guy Kawasaki’s 10/20/30 rule, intended for a venture-capital pitch, uses 10 slides, 20 minutes, and a minimum 30-point font. Pecha Kucha uses 20 slides that advance every 20 seconds. These are editing disciplines, not universal laws. Jill Bolte-Taylor’s TED talk used only a few slides because her storytelling and a real human brain carried the presentation. Sometimes the right choice is a flip chart, a handout, or no projection.
Rehearsal turns presentation from text recitation into skilled performance. The speaker can attend to timing, audience response, and emphasis only when the content is sufficiently familiar. Constraints help expose what is essential, but rigid rules can misfit technical briefings, reference talks, or audiences that need detailed documentation. The deeper principle is to separate the live experience from the supporting record. A concise visual talk can coexist with a thorough handout. Choosing deliberately between those functions respects both the audience’s attention and its need for evidence.
Give teams reusable templates that preserve brand and clarity
Design for repeated use. In large organizations, many employees create presentations with uneven design experience. A template can provide stable layouts, color choices, image libraries, and examples for common content, making it easier to produce a coherent deck without requiring everyone to become a designer. It should reflect durable features of the organization’s identity, not a short-lived campaign.
Explain the reasoning. Hewlett-Packard’s system paired reusable layouts and visual assets with guidelines that explained why design choices had been made. That matters because a template is more useful when employees understand how to apply it, rather than treating it as a collection of boxes. Templates should match the organization’s actual communication needs, such as charts, diagrams, or product photography. Digital distribution also changes design requirements: a projected slide, a phone screen, and a printed handout do not offer the same viewing conditions.
Templates are organizational infrastructure. They reduce repeated decisions and help a brand remain recognizable across a large number of independent speakers. The HP example also points to an important distinction between standardization and control: people follow systems more intelligently when they understand the rationale. Yet templates can institutionalize stale assumptions or encourage every message to look alike. Their value depends on maintenance, flexibility, and a route for exceptions. A good system saves effort on routine choices while preserving judgment for unusual content and audiences.
Analysis
slide:ology is a practical design manual with a deeper argument: presentation software did not eliminate the need for visual communication skills, it made those skills everyone’s responsibility. The book’s sequence reflects that claim. It begins with purpose and audience, moves through ideation and visual explanation, then addresses the mechanics of slides, animation, templates, and live delivery. The progression matters because visual polish is downstream of deciding what a presentation is for.
Its most durable contribution is the insistence that slides are not miniature documents. A speaker and a screen compete for attention when both carry the same dense verbal content. Duarte instead treats a presentation as a coordinated experience: the speaker supplies context and judgment, while visuals expose relationships, sequence, and emphasis. This makes the book relevant beyond software tutorials. It connects information design to leadership, teaching, sales, and institutional trust. The method is strongest when it turns abstract advice into inspectable choices. Should this process be a loop or a line? Which data point deserves emphasis? Does the image fit the audience and the brand? Such questions make design teachable. The broad advice to simplify, however, needs discipline. Some audiences need precise tables, complete assumptions, or time to inspect evidence. Removing complexity can improve comprehension, but it can also conceal uncertainty. The book’s emphasis on truthful data and supporting handouts provides a useful counterweight.
The overall lesson is neither that every deck needs custom illustration nor that fewer words automatically mean better communication. It is that each element should earn its place by helping a specific audience understand something, remember it, or act. That standard applies equally to a dramatic keynote, an internal update, and a shared reference deck. Good slides are not decoration around an idea. They are a designed path through it.
Review Summary
slide:ology receives mixed reviews, with an overall positive rating. Readers appreciate its visual appeal and practical tips for creating effective presentations. Many find it helpful for improving slide design and storytelling. However, some criticize it for being too basic or focused on high-level presentations. The book is praised for its layout, examples, and emphasis on visual communication. Critics note that it may not be as useful for those with design experience or specific presentation needs. Overall, it's recommended for those looking to enhance their presentation skills.
Glossary
slideument
Document disguised as slidesA slideument is a presentation file overloaded with text and detail so that it functions more like a document than a visual aid. The audience is expected to read the slides, often while the speaker delivers the same material. The term helps distinguish a presentation meant for live communication from a document meant for independent study.
audience persona
Profile of a typical listenerAn audience persona is a practical profile of a representative listener, including circumstances, motivations, concerns, expectations, and likely objections. It helps a presenter test whether the content addresses an audience’s needs and suggests a useful action. It is a planning aid rather than a demographic fact or a slide intended for projection.
visual vertigo
Discomfort from confusing visualsVisual vertigo describes the subtle agitation that can result when presentation graphics contain inconsistent perspectives, lighting, or distracting animation. The audience must resolve visual contradictions while trying to follow the message. The term emphasizes that incoherent design can reduce receptiveness and confidence, even when viewers cannot identify exactly what feels wrong.
Roman Room
Memory through imagined placesThe Roman Room is a mnemonic technique in which a speaker imagines a familiar or constructed place and associates parts of a talk with locations within it. Moving mentally through the rooms cues the sequence of ideas. Bill McDonough describes using architectural spaces and routes to remember a story without depending on the projected slides.
Pecha Kucha
Timed short-form presentationPecha Kucha is a presentation format using 20 slides, each shown for 20 seconds, for a total of six minutes and 40 seconds. The fixed pace forces presenters to edit tightly and gives each idea a brief window. It is a specific format for concise talks, not a general rule for every presentation.
Lessig Method
Rapid slides, one idea eachThe Lessig Method refers to a fast-paced presentation style associated with law professor Lawrence Lessig. Slides change frequently and typically carry one large idea at a time, closely matching the speaker’s spoken rhythm. The approach can create energy and clarity, but it depends on practiced delivery and is not suitable for every subject or audience.
10/20/30 rule
Pitching constraint for slide decksThe 10/20/30 rule is a presentation guideline associated with Guy Kawasaki’s venture-capital pitches: use 10 slides, speak for no more than 20 minutes, and use type no smaller than 30 points. Its purpose is to force prioritization and readability. It is best understood as a constraint for a particular pitching context, not a universal slide-count formula.
FAQ
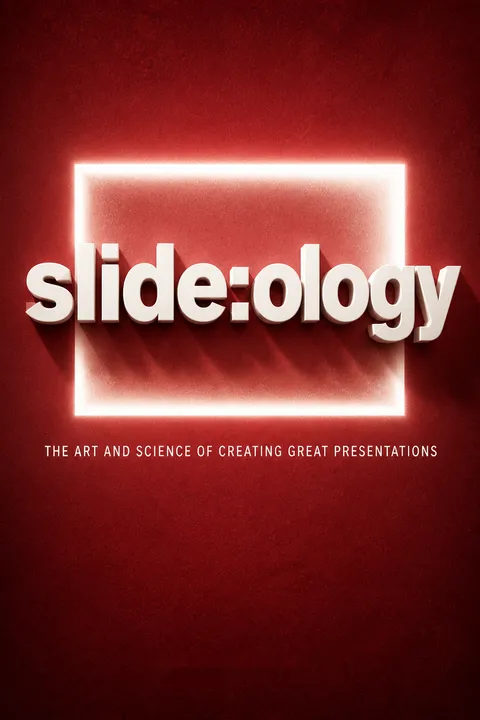
What's "slide:ology: The Art and Science of Creating Great Presentations" about?
- Presentation Design Focus: "slide:ology" by Nancy Duarte is a comprehensive guide on creating effective and visually appealing presentations. It emphasizes the importance of design in communication.
- Visual Storytelling: The book explores how to use visual elements to tell a compelling story, making complex information more accessible and engaging for audiences.
- Practical Techniques: It provides practical techniques for designing slides, including the use of diagrams, data visualization, and the strategic use of color and typography.
- Audience Engagement: The book also covers how to connect with audiences emotionally and intellectually, ensuring that presentations are not just informative but also memorable.
Why should I read "slide:ology"?
- Enhance Presentation Skills: Reading "slide:ology" will significantly improve your ability to create presentations that are both visually stunning and effective in communication.
- Professional Edge: The book offers insights that can give you a professional edge, whether you're in business, education, or any field that requires public speaking.
- Comprehensive Guide: It serves as a comprehensive guide, covering everything from the basics of slide design to advanced techniques for engaging audiences.
- Real-World Examples: The book includes real-world examples and case studies, providing practical applications of the concepts discussed.
What are the key takeaways of "slide:ology"?
- Design Matters: Good design is crucial for effective communication and can significantly impact how your message is received.
- Audience-Centric Approach: Always consider the needs and expectations of your audience when designing your presentation.
- Visual Storytelling: Use visuals to tell a story and make your message more relatable and memorable.
- Practice and Rehearsal: Effective presentations require practice and rehearsal to ensure smooth delivery and audience engagement.
How does Nancy Duarte suggest using visuals in presentations?
- Visual Grammar: Duarte emphasizes the use of strong visual grammar to engage all the senses of the audience, making the message more impactful.
- Diagrams and Data: She advocates for the use of diagrams and data visualization to simplify complex information and highlight key points.
- Consistency and Clarity: Visual elements should be consistent and clear, avoiding unnecessary clutter that can distract from the main message.
- Emotional Connection: Use visuals to create an emotional connection with the audience, making the presentation more engaging and memorable.
What is the "Presentation Ecosystem" according to Nancy Duarte?
- Three-Legged Stool: Duarte describes the presentation development process as a three-legged stool consisting of message, visual story, and delivery.
- Interdependence: Each component is interdependent, and neglecting one can weaken the overall presentation.
- Audience-Centric: The ecosystem emphasizes the importance of understanding and addressing audience needs and expectations.
- Harmonious Balance: Achieving a harmonious balance between these elements is crucial for a successful presentation.
How does "slide:ology" address the use of data in presentations?
- Clarity Over Complexity: Data slides should prioritize clarity over complexity, focusing on the meaning rather than the data itself.
- Truth and Integrity: Present data with integrity, ensuring that it is accurate and credible to maintain audience trust.
- Highlight Key Points: Use visual emphasis to highlight key points and conclusions drawn from the data.
- Appropriate Tools: Choose the right tools and charts to effectively communicate the data's message.
What are some best practices for slide design mentioned in "slide:ology"?
- Contrast and Hierarchy: Use contrast and hierarchy to guide the audience's attention and emphasize important information.
- Whitespace Utilization: Employ whitespace effectively to give visual breathing room and prevent clutter.
- Consistent Visual Elements: Maintain consistency in visual elements such as color, typography, and layout to create a cohesive presentation.
- Audience Engagement: Design slides that engage the audience, using visuals to support the narrative rather than distract from it.
What role does storytelling play in "slide:ology"?
- Central to Communication: Storytelling is central to effective communication, helping to make complex ideas more relatable and memorable.
- Visual Storytelling: Use visuals to enhance the narrative, creating a more engaging and immersive experience for the audience.
- Emotional Connection: A well-told story can create an emotional connection with the audience, making the message more impactful.
- Structure and Flow: Storytelling provides structure and flow to the presentation, guiding the audience through the content in a logical and compelling way.
How does Nancy Duarte suggest handling audience interaction?
- Audience as King: Treat the audience as the most important aspect of the presentation, focusing on their needs and expectations.
- Engagement Techniques: Use techniques such as asking questions, encouraging participation, and addressing audience concerns to foster interaction.
- Feedback and Adaptation: Be open to audience feedback and adapt the presentation as needed to maintain engagement and relevance.
- Building Relationships: Cultivate a meaningful relationship with the audience, ensuring that the presentation is a two-way communication.
What are some common mistakes in presentations that "slide:ology" helps to avoid?
- Overloading Slides: Avoid overloading slides with text and data, which can overwhelm and confuse the audience.
- Lack of Rehearsal: Failing to rehearse can lead to a disjointed and ineffective presentation, so practice is essential.
- Ignoring Design Principles: Neglecting design principles such as contrast, hierarchy, and whitespace can result in a visually unappealing presentation.
- Neglecting Audience Needs: Focusing too much on the presenter's needs rather than the audience's can lead to disengagement and a lack of impact.
What are the best quotes from "slide:ology" and what do they mean?
- "Treat Your Audience as King": This quote emphasizes the importance of prioritizing the audience's needs and expectations in every aspect of the presentation.
- "Spread Ideas and Move People": It highlights the goal of presentations to not only inform but also inspire and motivate the audience to take action.
- "Help Them See What You're Saying": This quote underscores the power of visual storytelling in making complex ideas clear and relatable.
- "Practice Design, Not Decoration": It advises focusing on meaningful design that enhances communication rather than superficial decoration.
How can "slide:ology" help improve my public speaking skills?
- Confidence Through Preparation: The book emphasizes the importance of preparation and rehearsal, which can boost confidence and reduce anxiety.
- Engaging Delivery: It provides tips on engaging delivery techniques, such as storytelling and audience interaction, to captivate the audience.
- Visual Support: Well-designed slides can serve as effective visual support, helping to reinforce key points and keep the presentation on track.
- Audience Connection: By focusing on the audience's needs and expectations, the book helps presenters build a stronger connection and rapport with their listeners.
About the Author
Download PDF
Download EPUB
.epub digital book format is ideal for reading ebooks on phones, tablets, and e-readers.








