

Key Takeaways
Ask what a statistic measures before letting it tell you who was best.
Numbers carry assumptions. Baseball’s familiar statistics can look like neutral facts while quietly answering narrow or misleading questions. Batting average counts hits per at-bat, but excludes walks and treats a single like a home run. In team data from 2011 to 2015, batting average correlated less strongly with runs scored than on-base percentage or slugging percentage. Adding those two gave OPS, which correlated most strongly of all, but its formula combines unlike measures and can mislead when comparing individual hitters.
Tradition has momentum. The book traces how old statistics persist because fans, writers, and teams inherited them, not because they reliably measure performance. That matters: distorted measures have shaped awards, contracts, playing time, and public understanding of the game. Better analysis begins by asking what a number includes, what it leaves out, and whether it answers the question at hand.
This is a lesson in measurement, not just baseball. A metric is a model of reality: deciding what to count also decides what becomes visible and what disappears. That makes familiar numbers especially powerful, since repetition can make a convention feel like nature. The caution is that a better measure is not automatically a complete one. Correlation with team runs, for example, does not prove that a statistic captures an individual’s contribution. The useful habit is to treat every number as an argument with assumptions, then check whether those assumptions fit the decision being made.
Judge hitters by reaching base and power, not by a batting crown.
Outs are the cost. On-base percentage, or OBP, measures how often a batter reaches base safely, including through walks and hit-by-pitches. It captures a hitter’s ability to avoid making an out, a scarce resource in a game with only 27 outs per team. Slugging percentage adds a rough measure of power by counting total bases per at-bat, though it does not assign each hit its true run value.
Use weighted measures. Weighted on-base average, or wOBA, gives different offensive events different weights while staying on a scale similar to OBP. Weighted Runs Created Plus, or wRC+, adjusts offensive production for park and league. These measures explain why Magglio Ordoñez’s 2007 batting title did not make him a better offensive player than Alex Rodriguez, who hit fewer singles but produced far more power and drew more walks.
The emphasis on outs connects baseball value to opportunity cost: an offensive event matters partly because of what it avoids consuming. The same logic appears in economics, where a resource has value not only for what it produces but for what it allows next. OBP is especially useful because it captures several skills at once, including contact, pitch recognition, and patience. Still, no single rate tells the whole story. A hitter’s value also depends on playing time, defense, baserunning, and context, so the book’s preferred measures work best as parts of an evaluation rather than as new crowns.
Price every stolen base against the out it risks.
A gain has a price. Run expectancy estimates the average runs a team can expect to score from a particular combination of occupied bases and outs. In the 2015 major-league environment, stealing second with no outs increased expected runs from 0.84 to 1.08 if successful. Getting caught dropped the expectation to 0.26. In that situation, a runner needed to succeed about 71 percent of the time for the attempt to be worthwhile.
Small ball can shrink innings. With a runner on first and no outs, a successful sacrifice bunt lowered the chance of scoring at least one run from roughly 50 percent to 45 percent. The calculation changes with the hitter, pitcher, ballpark, and base-out state, so it is not a universal commandment. It is a better starting point than assuming that movement or a visibly advancing runner must help.
Expected value forces attention onto both sides of a decision: the reward if it works and the damage if it fails. That discipline is useful well beyond baseball, where dramatic actions often feel valuable simply because they are visible. The numerical threshold also illustrates why rules of thumb should be conditional. A steal becomes more attractive when runs are scarce or the batter is unlikely to drive the runner in, and less attractive when a powerful hitter is at the plate. The model clarifies the tradeoff, but good application still requires situation-specific information.
Do not confuse team outcomes or job titles with individual skill.
Credit gets misassigned. A pitcher’s win depends on teammates scoring and on the bullpen and defense holding the lead. A batter’s RBI total depends heavily on how often teammates reach base ahead of him. Barry Bonds hit 73 home runs in 2001 but had only 137 RBI, partly because he often came up with the bases empty. Neither total isolates what the player controlled.
Saves shape behavior. A save is awarded under specific conditions involving the lead, inning, and pitcher’s role. That label helped create the idea of a special closer and encouraged managers to reserve their best relievers for qualifying situations. In the 2016 wild-card game, Orioles manager Buck Showalter never used Zach Britton, despite his extraordinary season. The save statistic describes a role and context, not a complete measure of a reliever’s quality.
These statistics reveal a classic attribution problem: outcomes produced jointly by a system are credited to one visible actor. The danger is not merely unfair praise or blame. Once a measure affects salaries, awards, or managers’ choices, people adapt their behavior to earn the measure, even when doing so may hurt the larger goal. The save rule is a vivid case because its accounting convention helped create the job it supposedly measured. A useful evaluation separates contribution from opportunity, then asks whether the institution’s incentives are pushing people toward the wrong opportunities.
Grade defense by plays prevented, not errors avoided.
Errors are an incomplete record. Fielding percentage rewards fielders for handling balls they reach, but ignores balls they fail to reach. Its error count also relies on subjective calls by official scorers. A player may let a playable ball fall without being charged an error, while a fielder who ranges farther can accumulate more recorded errors by attempting difficult plays.
Range changes the comparison. Ozzie Smith played fewer innings at shortstop than Omar Vizquel but recorded substantially more assists and putouts. Modern defensive measures compare plays made with the likelihood that a fielder at that position would make them, then estimate the runs saved or allowed. Those estimates remain imperfect, especially when positioning and shifts are not fully observed, but they ask a more relevant question than whether a fielder avoided official mistakes.
The contrast resembles a broader problem in performance measurement: counting visible failures is easier than identifying missed opportunities. A safe but passive worker can appear more reliable than someone who takes on difficult tasks, even when the latter produces greater value. Defensive metrics try to correct that asymmetry by estimating what could have happened, which brings uncertainty into the calculation. Their strength is not perfect precision, but a better definition of the job. The right response to imperfect estimates is to inspect their assumptions and uncertainty, not to retreat to a measure that ignores range altogether.
Separate a pitcher's scoreboard results from his repeatable skill.
ERA records outcomes. Earned run average divides earned runs allowed by innings pitched, then scales the result to nine innings. It helps describe what happened, but errors, defensive quality, inherited runners, and sequencing can distort it. Batting average on balls in play, or BABIP, measures how often balls put into the field become hits. Research discussed in the book found that a pitcher’s BABIP tends to move toward the league average, making it a noisy guide to future performance.
FIP estimates components. Fielding Independent Pitching, or FIP, uses strikeouts, walks, and home runs to estimate performance while replacing the pitcher’s actual BABIP with a league-average value. It can help forecast, but may discount pitchers with a genuine ability to limit damaging contact. ERA tells more of the actual result; FIP often offers a cleaner, though still incomplete, view of underlying skill.
This distinction is central to scientific reasoning: describing an observed result and predicting a future result are different tasks. A pitcher can deserve credit for runs prevented while also having benefited from defense that may not be there next season. Conversely, a strong process can yield a poor short-term outcome. The disagreement between ERA and FIP is therefore informative, not a reason to declare one measure fraudulent. It points to the uncertain boundary between individual agency and team context, a boundary that better data can narrow without making it disappear.
Use evidence, not pressure narratives, to explain decisive moments.
Clutch is not a stable label. Studies reviewed in the book found little evidence that major-league hitters reliably perform better in high-pressure situations than their ordinary ability would predict. A famous hit can be clutch in its effect without proving its hitter has a repeatable clutch skill. The same caution applies to the hot hand: streaks can emerge naturally from random variation, and apparent patterns do not automatically reveal a change in talent.
WPA tells a different story. Win Probability Added, or WPA, tracks how a play changes a team’s historical chance of winning, given the score, inning, and base-out situation. It can describe a game’s turning points, including a walk or hit-by-pitch that changes the odds sharply. But because it depends on context and opportunity, WPA is not a reliable measure of a player’s underlying skill or future performance.
Humans are unusually good at turning sequences into stories and unusually poor at noticing how often randomness produces clusters. That tendency makes sports narratives compelling, but it can also turn an outcome into a supposed personality trait. WPA offers a useful compromise: it preserves the drama of context while refusing to treat dramatic impact as proof of a durable skill. Its limitation is equally important. A metric can faithfully describe what mattered in one game without answering why it happened or whether it will happen again.
Treat WAR as a transparent estimate, not a verdict.
One framework, many choices. Wins Above Replacement, or WAR, estimates a player’s total contribution above a readily available replacement-level player. It combines offense, baserunning, defense, and, for pitchers, run prevention, then expresses the result in wins. Different versions make different choices about how to value defense and pitching, so WAR is a framework for adding contributions, not one definitive formula.
Baselines shape history. WAR helps compare players across positions and eras, making it useful in Hall of Fame debates. Lou Whitaker produced about 75 career WAR yet received only 2.9 percent of votes in his only year on the ballot. That contrast shows what a value framework can expose, but a career total still cannot settle every question about peak, longevity, or uncertainty. The assumptions behind the number deserve attention alongside the number itself.
WAR’s value lies in making its accounting problem explicit: teams have limited money and roster spots, so they need a way to compare unlike contributions. The same need arises in public policy and organizational planning, where decisions require a shared unit even when the underlying values differ. The risk is reification, treating an estimate as if it were a physical property of the player. A sound use of WAR asks what version, baseline, and inputs produced the result, and then checks whether the decision depends on a difference smaller than the model can confidently resolve.
Pair scouts' eyes with Statcast measurements, then keep testing.
Scouting and statistics answer different questions. Scouts assess mechanics, physical development, tools, and details that numbers may not explain. Statcast combines radar and optical tracking to record events such as exit velocity, launch angle, spin rate, and fielder positioning. Those measurements turn impressions into testable evidence. For example, hard contact alone does not guarantee extra bases: the ball’s launch angle also affects whether it becomes a groundout, a productive line drive, or a flyout.
Data need interpretation. Teams can use these measures to refine positioning, develop players, and investigate fatigue or injury risk. But large data sets require cleaning, and a measured pattern is not automatically a cause. The stronger approach combines measurement with scouting and coaching, then checks whether a proposed change improves performance. Better tools expand the questions teams can ask; they do not remove judgment or uncertainty.
The collaboration described here resembles human-machine decision systems in medicine and engineering. Instruments are excellent at measuring repeatable features; experienced observers can notice context, exceptions, and mechanisms that a model does not yet represent. Neither source deserves automatic authority. The book’s examples also expose a key danger of optimization: improving a measurable attribute, such as exit speed, may not improve the desired outcome if launch angle or contact quality is wrong. The most useful analytics culture treats findings as hypotheses for development, with feedback from the field rather than a one-way transfer of numbers.
Analysis
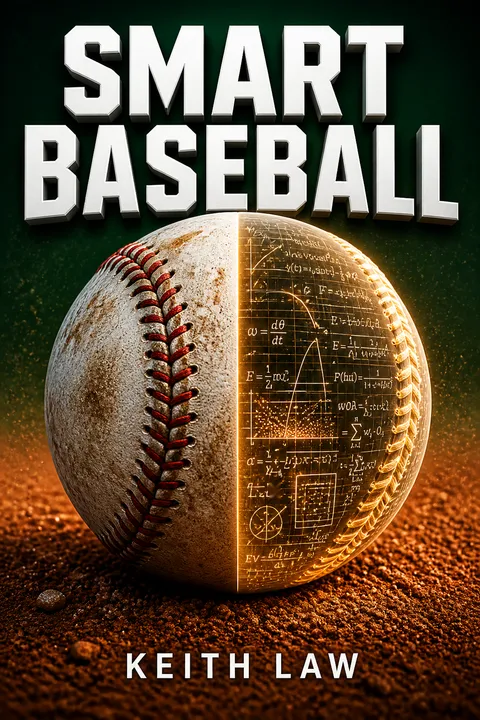
Smart Baseball is best understood as an argument about how measurement changes a sport. Its story begins with inherited box-score statistics that appear simple and objective, then shows how their omissions distort decisions. The replacement is not a hunt for one perfect number. It is a layered practice: define the question, choose a measure suited to it, distinguish observed results from repeatable ability, and make uncertainty visible.
The book’s strongest examples show that metrics can alter behavior as well as describe it. Saves helped create the modern closer role, while RBI totals and pitcher wins influenced awards and contracts. A statistic can therefore become part of the system it measures. This is a consequential point: evaluation tools are not passive when institutions reward them. Better measurement must be paired with incentives that reward the underlying goal, such as winning games, rather than the proxy.
The adaptation also needs to retain the book’s tensions. OBP is more informative than batting average, but does not capture power. FIP may forecast better than ERA, but can under-credit real pitcher skill or credit assumptions about average defense. Defensive metrics estimate missed plays, yet their judgments rely on data quality and modeling choices. WAR makes broad comparisons possible, but different versions can produce different totals. These are not embarrassing flaws to conceal. They are the conditions under which the numbers should be used.
The larger lesson is a form of disciplined skepticism. Traditional statistics should not survive merely because they are familiar, and advanced statistics should not win merely because they look technical. Ask what a measure counts, what it ignores, whether it describes or predicts, and how people change their behavior when it is rewarded. That approach lets fans understand the game more accurately while leaving room for new evidence to revise today’s best answers.
Review Summary
Smart Baseball receives generally positive reviews, with readers praising Law's clear explanations of modern baseball statistics and their advantages over traditional metrics. Many find the book informative and eye-opening, especially for those unfamiliar with sabermetrics. Some criticize Law's snarky tone and repetitiveness, particularly in the first half. The book is seen as a valuable resource for understanding contemporary baseball analysis, though readers familiar with advanced stats may find less new information. Overall, it's recommended for baseball fans looking to deepen their statistical knowledge.
People Also Read
Glossary
Sabermetrics
Baseball performance analysisThe statistical analysis of baseball performance and strategy. Sabermetrics uses data to evaluate what players contribute, estimate future performance, and test conventional beliefs about the game. The term covers a range of methods, from comparing basic statistics to building models that estimate runs, wins, or defensive value.
Run Expectancy Matrix
Expected runs by game stateA table showing the average runs a team scores from a specific combination of occupied bases and outs. It lets analysts compare the expected value of decisions such as stealing, bunting, or advancing a runner. The values depend on the run-scoring environment and can differ between major-league and amateur baseball.
Linear weights
Run values for batting eventsA method of valuing a hitter by assigning an average run value to each event, such as a single, walk, home run, or out, and summing those values. The weights reflect the run-scoring environment and can change across seasons. The method aims to credit each contribution without assigning an entire team run to one hitter.
wOBA
Weighted hitting rateWeighted On-Base Average assigns different run-based weights to batting events, including walks, hit-by-pitches, and different kinds of hits. It is designed to assess a hitter’s overall offensive rate on a scale similar to on-base percentage. Unlike some alternatives, the version described in the book is not adjusted for the hitter’s ballpark.
wRC+
Park-adjusted batting rateWeighted Runs Created Plus estimates a hitter’s offensive production, adjusts for league and ballpark, and places the result on a scale centered at 100. A value above 100 indicates production above league average; a value below 100 indicates below-average production. It is useful for comparing hitters across parks and seasons.
BABIP
Hits on balls in playBatting Average on Balls In Play measures the rate at which a pitcher’s or hitter’s balls put into the field become hits, excluding home runs. Pitchers’ BABIP figures tend to vary and move toward the league average, so the measure can reflect defense and chance as well as performance. Some pitchers and hitters may have genuine abilities that affect it.
FIP
Defense-adjusted pitching estimateFielding Independent Pitching estimates a pitcher’s performance using strikeouts, walks, hit batters, and home runs, while substituting a league-average result for balls in play. It is scaled similarly to ERA and is often useful for forecasting. Because it removes actual results on balls in play, it can miss real skill or unusual context.
WPA
Change in win probabilityWin Probability Added measures how much a play changes a team’s estimated chance of winning, based on the score, inning, and base-out situation. It is a descriptive measure of a player’s impact in game context. Since it depends heavily on timing and opportunity, it is not a dependable measure of underlying skill or future performance.
WAR
Total value above replacementWins Above Replacement estimates a player’s total contribution in wins compared with a replacement-level player, a readily available baseline. It combines measurable contributions such as batting, baserunning, fielding, and pitching. WAR is a framework rather than a single formula: different versions use different estimates, adjustments, and assumptions.
Statcast
Ball and player tracking systemMajor League Baseball’s tracking system combines radar and optical technologies to record detailed information about pitches, batted balls, and player movement. Measurements include pitch speed and spin, exit velocity, launch angle, and fielder positioning. These data allow teams to examine skills and plays in greater detail, while still requiring cleaning and interpretation.
FAQ
What's Smart Baseball about?
- Focus on Baseball Statistics: Smart Baseball by Keith Law delves into the evolution of baseball statistics, highlighting the inadequacies of traditional metrics like batting average and pitcher wins.
- Advocacy for New Metrics: The book champions newer, more precise statistics such as on-base percentage (OBP), slugging percentage, and advanced metrics like wOBA and WAR for evaluating player performance.
- Critique of Conventional Wisdom: Law challenges long-standing beliefs in baseball, such as the concept of clutch hitters and the value of the save statistic, arguing these are often misleading.
Why should I read Smart Baseball?
- Understanding Modern Baseball: The book provides insights into how modern baseball analysis has evolved, explaining why traditional stats are often insufficient.
- Enhanced Fan Knowledge: It aims to educate fans, journalists, and analysts on critical thinking about player performance and the statistics used to measure it.
- Engaging Presentation: Keith Law presents complex ideas in an engaging manner, making them accessible to both casual fans and serious analysts.
What are the key takeaways of Smart Baseball?
- Flaws in Traditional Stats: Law highlights the shortcomings of traditional statistics like batting average and pitcher wins, describing them as misleading.
- Importance of Advanced Metrics: The book emphasizes the significance of metrics like OBP, wOBA, and WAR in providing a comprehensive view of a player's value.
- Role of Data in Decision-Making: Law illustrates how teams increasingly rely on data for player acquisitions and game strategies, integrating analytics into baseball operations.
What are the best quotes from Smart Baseball and what do they mean?
- "OBP Is Life": This quote underscores the argument that on-base percentage is crucial for evaluating hitters, as it correlates directly with scoring runs.
- "Batting average... has been falling out of favor": Reflects the shift towards more reliable metrics, indicating traditional stats are becoming obsolete.
- "The save statistic is a travesty": Highlights Law's strong criticism of the save statistic, suggesting it misrepresents a pitcher's contributions.
How does Smart Baseball redefine the value of pitcher wins?
- Misleading Metric: Law argues that pitcher wins are misleading as they attribute game outcomes solely to the pitcher, ignoring team contributions.
- Context Matters: The book emphasizes evaluating pitchers based on their ability to prevent runs, not just the number of wins.
- Focus on Advanced Metrics: Law advocates for using metrics like FIP (Fielding Independent Pitching) to assess a pitcher's true performance.
What is the significance of on-base percentage (OBP) in Smart Baseball?
- Core Hitting Metric: OBP measures how often a player reaches base, essential for scoring runs.
- Predictive of Success: Teams with higher OBP tend to score more runs, making it a better predictor of offensive success than batting average.
- Foundation for Other Stats: OBP serves as a building block for advanced metrics like wOBA, refining our understanding of offensive contributions.
What does Smart Baseball say about the concept of clutch hitting?
- Clutch Hitting is a Myth: Law argues that there is no such thing as a clutch hitter; good hitters perform consistently regardless of the situation.
- Statistical Evidence: Studies show players labeled as clutch do not perform significantly better in high-pressure situations.
- Focus on Overall Performance: Law emphasizes evaluating players based on their overall hitting ability and consistency.
How does Smart Baseball critique the save statistic?
- Arbitrary Definition: Law describes the save rule as convoluted, leading to poor managerial decisions.
- Misallocation of Resources: Emphasis on saves has led teams to overvalue certain relievers while underutilizing others.
- Impact on Game Strategy: The save statistic has changed bullpen deployment, often to the detriment of team success.
What advanced metrics does Smart Baseball introduce for evaluating players?
- wOBA (Weighted On-Base Average): Provides a nuanced view of offensive contributions by assigning different weights to outcomes.
- WAR (Wins Above Replacement): Quantifies a player's overall value, combining offensive and defensive contributions.
- FIP (Fielding Independent Pitching): Measures a pitcher's effectiveness by focusing on outcomes they control, like strikeouts and walks.
What is the significance of FIP in Smart Baseball?
- Predictive Power: FIP predicts a pitcher's future ERA based on strikeouts, walks, and home runs allowed.
- Separating Pitcher Performance: Isolates a pitcher's contributions from their defense, allowing clearer evaluation.
- Limitations of FIP: While valuable, FIP can overlook skills like limiting hard contact, necessitating multiple metrics for evaluation.
How does Smart Baseball explain the impact of Statcast data?
- Revolutionary Data Source: Statcast provides detailed information on player movements and pitch characteristics, allowing precise performance analysis.
- Integration with Scouting: Enhances traditional scouting by providing objective measurements to support evaluations.
- Future Implications: Ongoing analysis of Statcast data will shape baseball's future, influencing player development and strategies.
What are the challenges of integrating analytics into baseball operations as discussed in Smart Baseball?
- Cultural Resistance: Resistance from traditionalists can hinder full analytics integration, crucial for maximizing data benefits.
- Data Overload: The volume of data can be overwhelming, requiring effective strategies for management and interpretation.
- Balancing Data and Intuition: Successful teams integrate analytics with the intuition and experience of scouts and coaches.
Download PDF
Download EPUB
.epub digital book format is ideal for reading ebooks on phones, tablets, and e-readers.








