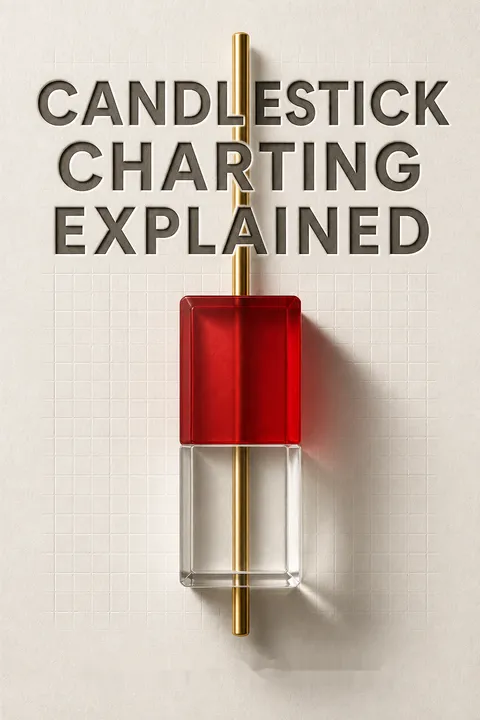


Key Takeaways
Use candles to see the trading day, not to discover new prices.
Same data, clearer picture. A candlestick uses the same four prices as a bar chart: open, high, low, and close. Its body connects the open and close, while thin shadows extend to the high and low. In the book’s convention, a white body means the close was above the open; a black body means it was below. The chart adds no new market data, but makes the day’s direction and range easier to scan.
A visual reading aid. Morris argues that candle shapes help reveal the short-term contest between buyers and sellers. Their value is interpretive: the chart makes price relationships more legible, but does not explain why a price moved or guarantee what comes next.
The distinction between data and display is important. A clearer visual encoding can help a reader notice relationships that are easy to miss in a dense bar chart, much as a well-designed map makes a route easier to perceive without changing the terrain. But visual fluency can also invite overconfidence. Candles depict price outcomes; claims about trader psychology are interpretations of those outcomes, not direct measurements of anyone’s thoughts.
Name the trend before calling a candle a reversal.
Context gives the signal meaning. A bullish reversal pattern only makes sense after a decline, and a bearish reversal only makes sense after an advance. The same candle shape can mean something different when it appears in another trend. Morris therefore treats trend identification as a prerequisite, not a finishing touch.
Keep the horizon short. The book uses a 10-day exponential moving average as one practical way to classify short-term direction. It also warns against reading candle patterns as long-range forecasts: Morris says moves beyond roughly five trading days are more likely to be coincidental than attributable to the pattern. The trend supplies context, while the pattern offers a limited-time clue.
This is a useful form of conditional reasoning: a signal is not meaningful in isolation, but relative to the state of the market in which it appears. The moving average makes that state easier to define consistently, though a 10-day setting is a choice, not a law of nature. Different trend rules can label the same day differently, so a trader should settle on a method before judging a pattern rather than adjust the context to fit a desired signal.
Read the body for the close, and the shadows for the struggle.
Four prices, two clues. The real body is the distance between the open and close. The shadows show how far the price traveled beyond those points before the session ended. A long body signals a larger open-to-close move; long shadows paired with a small body suggest the price moved widely but finished near its starting point.
Indecision has a shape. A Doji forms when the open and close are equal or nearly equal. Morris treats it as evidence of hesitation, not proof of a trend reversal. A spinning top also has a small body, but its upper and lower shadows are relatively long. Where either appears matters: a Doji after a strong move may be more noteworthy than one among several days of indecision.
The body-shadow distinction gives readers a compact vocabulary for describing a session without pretending that every session has a clear winner. It also helps separate direction from volatility: a large range can coexist with little net progress. The caution is that one candle compresses an entire session into four values. It cannot show the sequence of trades, the cause of a sudden move, or whether the same shape reflects different market conditions.
Treat reversal candles as alerts, not self-sufficient trade commands.
A pattern is a hypothesis. The Hammer, for example, has a small body near the day’s high and a long lower shadow. After a decline, it suggests that lower prices failed to hold. The same shape after an advance is called a Hanging Man and warns that selling appeared during the session. Engulfing patterns use two opposite-colored bodies, with the second covering the first; Harami patterns reverse that arrangement and signal a pause.
Demand evidence. Morris’s tested data show why labels should not replace judgment. Across seven horizons, the Hanging Man averaged about 59 percent winning outcomes, while the Hammer averaged about 48 percent. Results depend on the test method and context, so confirmation from price action or another technical tool remains prudent.
The contrast between two visually similar patterns is a reminder that location and prior movement can matter as much as shape. The reported percentages also resist the seductive idea of a universally reliable formation. Even a pattern with a better-than-even historical result can lose often, and its average says little about the size or timing of losses. A trader needs an exit plan as well as a reason to enter.
Recognize pauses before mistaking them for trend changes.
Markets can rest mid-move. In the Rising Three Methods pattern, a strong upward candle is followed by several smaller countertrend days that remain largely within its range, then another strong upward day. The Falling Three Methods reverses the direction. These formations describe a pause within an established trend, not a promise that the trend will last indefinitely.
An older trading tradition. Morris connects such patterns to Sakata’s Method, a family of ideas associated with eighteenth-century Japanese rice trader Munehisa Honma. The method grouped recurring market behavior around tops and bottoms, gaps, directional runs, and pauses. The book recounts Honma’s emphasis on patient observation and record keeping. Its lesson is less about mystique than about watching repeated price behavior before acting.
Continuation patterns are valuable because they complicate the simple story that every conspicuous candle marks a turning point. A pause can be a pause, and a reversal can fail. The historical framing is evocative, but tradition alone cannot establish predictive power. The practical strength of the idea lies in its testable description: prices advance, consolidate, and either resume or do not. That sequence can be checked without accepting claims of ancient secrets.
Trust pattern statistics only within their tested horizon.
Large samples, mixed results. Morris reports tests across 7,275 common stocks and more than 14.6 million trading days. The study examined whether patterns correctly anticipated price direction over intervals of one to seven days. Many results clustered near chance, while some patterns did better and others worse. Rare formations are especially hard to assess: an impressive result from a handful of examples is weak evidence.
Frequency matters too. Across the full set of patterns, the book reports roughly one occurrence every nine market days in the combined data. That does not mean any particular pattern appears that often. A pattern’s historical win rate also does not establish profitability, since the tables do not make every trading cost or execution problem disappear.
The book’s willingness to publish weak and inconsistent findings is a strength. It shifts the conversation from pattern folklore to questions of sample size, horizon, and measurement. Yet a large dataset does not automatically settle the issue: results can depend on how patterns are defined, which securities are included, and how overlapping signals are handled. Historical frequency and directional accuracy are useful diagnostics, not substitutes for out-of-sample testing or risk-adjusted results.
Filter candle signals to trade less, not to guarantee more.
A second condition narrows the field. Candlestick filtering uses a technical indicator to decide when a candle signal is eligible. For instance, an indicator may enter an oversold zone before a bullish candle pattern is accepted. The indicator’s pre-signal area is the interval before its usual buy or sell trigger; only patterns matching that direction are kept. Morris tests indicators including RSI and Stochastics.
The reported benefit is selectivity. In the book’s historical tests, filtered candle strategies generally produced fewer trades and better results than using candle patterns alone or indicators alone. This is a research finding under specified settings, not a universal result. Changing the indicator, thresholds, sample period, or trading rules can change the outcome.
Filtering is a sensible attempt to make two imperfect signals answer different questions: the candle describes a short-term price event, while the indicator supplies a broader condition. That combination can reduce noise, but it can also create the appearance of precision through parameter selection. A filter deserves trust only if its settings are chosen in advance and then tested on data not used to design them. Fewer trades are useful only when the omitted trades are genuinely worse.
Pair candle sentiment with Western support and resistance.
Location changes the reading. Morris and contributor Ryan Litchfield argue that Western chart patterns can identify important price areas, while candlesticks help show how trading behaves as prices approach them. A Hammer-like candle at support may suggest buyers defended a level; the same shape away from a meaningful area may only mark a temporary pause. Candles can also show whether a gap holds, fills, or quickly reverses.
Read the approach, too. The authors compare price action near a turning point to a team arriving at a decisive game: the direction of travel matters, but so does the condition in which it arrives. A strong move, a hesitant approach, or a volatile rejection can imply different levels of conviction. Candles add detail to the location; they do not replace it.
This division of labor is one of the book’s most useful integrations. A chart level answers where a decision may matter; the candle helps describe what happened there. The model avoids asking a single indicator to do everything. Still, support and resistance can be drawn with considerable discretion, so the trader should define those levels consistently. Otherwise, both the location and the candle can be interpreted after the fact to support almost any story.
Set your risk rules before a candle turns analysis into action.
Good reading is not good execution. The book distinguishes market analysis from trading skill. A trader may identify a pattern correctly and still lose through fear, greed, impatience, or abandoning a plan during a rough patch. Morris urges readers to use candle patterns with other methods rather than treating them as a shortcut to profit.
Make the decision explicit. Before entering, determine what would confirm the signal, what would invalidate it, and how a position will be managed if prices move against the forecast. The Japanese trader Takehiro Hikita, interviewed in the book, emphasizes staying attentive to signals and using them alongside trend analysis. The core discipline is to treat the chart as evidence, then follow a defined process rather than improvise around each new candle.
This turns chart reading into a decision practice rather than a search for certainty. A written rule can reduce the temptation to reinterpret a losing signal as soon as emotion rises. It cannot eliminate uncertainty, and no pattern can make position sizing or execution irrelevant. The strongest version of the book’s advice is therefore modest: use candles to organize observations, but keep responsibility for risk with the trader, not the chart.
Analysis
Morris’s central contribution is not a claim that candle shapes reveal a hidden law of markets. It is an attempt to make a visual tradition testable, then to place it inside a wider process of technical analysis. That shift matters. The book moves from Japanese pattern names and market psychology toward explicit definitions, historical testing, and filtering. It asks readers to distinguish a memorable story about a pattern from evidence that the pattern predicts anything.
The book’s strongest ideas are methodological. Trend must be defined before reversal, prediction horizons should stay short, rare patterns deserve skepticism, and visual signals should be checked against other evidence. Its statistical results also undermine simplistic promotion: many formations hover near chance, while the best results vary by horizon and sample. The trader is asked to see candles as short-lived clues, not commands.
The evidence has limits. A large historical sample is not the same as an independent test of future performance. Pattern definitions, chosen indicators, thresholds, and evaluation rules all shape the result. The supplied material does not establish that every reported advantage survives transaction costs, changing market structure, or tests on data excluded from development. Nor does a candle directly measure psychology. It records prices, from which psychological interpretations are inferred.
The most durable synthesis is therefore practical rather than mystical. Western charting can identify a price area where a decision matters; candles can describe the session’s balance of movement and hesitation; an indicator can add a separate condition; and a risk plan governs the trade. None guarantees success. The method earns credibility when the components are defined consistently, tested independently, and used with a clear account of what they can and cannot establish.
Review Summary
Readers highly praise Candlestick Charting Explained for its practical approach to technical analysis. Many consider it the best book on candlestick charts, offering concise and applicable information. The performance tables for chart patterns are particularly valued. Some readers find certain sections statistically heavy, but overall, the book is seen as an essential reference for those in financial markets. It has significantly improved trading skills for many. While some information may be outdated in older editions, the core concepts remain relevant and useful.
People Also Read


Glossary
Real body (jittai)
Open-close price rangeThe real body is the thick portion of a candlestick, spanning the period’s opening and closing prices. A white body indicates that the close was higher than the open, while a black body indicates that the close was lower. Its size describes the net price movement during the period, not the full high-to-low range.
Shadows (kage)
High-low price extensionsShadows are the thin lines extending beyond a candlestick’s real body. The upper shadow marks the period high, and the lower shadow marks the period low. Their length shows how far prices moved beyond the open-close range before the period ended, adding information about the session’s range and volatility.
Doji
Near-equal open and closeA Doji is a candlestick in which the opening and closing prices are equal or close enough to count as equal under the chosen identification rules. It represents a session with little net movement between open and close. Morris treats it as a sign of uncertainty, not as automatic proof that a trend has reversed.
Sakata’s Method
Traditional pattern analysisSakata’s Method is a Japanese approach to reading market behavior associated with the rice trader Munehisa Honma. It organizes recurring price formations involving peaks and bottoms, gaps, directional runs, and pauses. Morris presents it as a historical foundation for candlestick pattern analysis, while emphasizing that the patterns remain tools rather than guarantees.
Candlestick filtering
Indicator-based signal selectionCandlestick filtering combines a candle pattern with a technical indicator. The indicator’s condition determines whether a bullish or bearish candle signal is accepted. Morris defines pre-signal areas in which an indicator has moved toward a buy or sell condition but has not necessarily triggered its usual signal. The goal is to reduce unqualified trades.
CandlePower charting
Candles with volume widthCandlePower charting adapts candlesticks by varying the width of each real body according to trading volume. Wider bodies represent higher volume and narrower bodies represent lower volume. This makes volume visible in the price chart itself, while preserving the candlestick’s open, high, low, close, and directional conventions.
Prediction interval
Days until evaluationA prediction interval is the number of trading days after a candle pattern at which its forecast is evaluated. Morris tests intervals from one to seven days, judging success by whether subsequent price behavior matches the pattern’s indicated direction. The interval matters because a pattern can appear useful over one horizon and weak over another.
FAQ
1. What is "Candlestick Charting Explained" by Gregory L. Morris about?
- Comprehensive candlestick guide: The book is a thorough manual on Japanese candlestick charting, covering pattern identification, philosophy, and practical trading applications.
- Market psychology focus: It explains how candlestick patterns visually represent trader sentiment and short-term market psychology, offering insights not available in other charting methods.
- Statistical validation: Gregory L. Morris supports candlestick analysis with rigorous statistical testing, using millions of days of market data to validate pattern effectiveness.
- Integration of East and West: The book bridges traditional Japanese techniques with Western technical analysis, providing a holistic approach to market interpretation.
2. Why should I read "Candlestick Charting Explained" by Gregory L. Morris?
- Evidence-based approach: The book’s findings are based on over 7 million days of market data, lending credibility to its conclusions about candlestick patterns.
- Bridges analysis and action: It teaches readers how to turn technical analysis into disciplined trading, addressing the psychological challenges of fear, greed, and hope.
- Practical trading tools: Readers gain actionable methods for pattern recognition, filtering, and integrating candlesticks with other technical indicators.
- For all experience levels: Both professional and individual traders can benefit from its clear explanations and practical advice.
3. What are the fundamental components of Japanese candlestick charts as explained by Gregory L. Morris?
- Candlestick structure: Each candlestick displays the open, high, low, and close, with the real body showing the difference between open and close, and shadows indicating price extremes.
- Types of candlesticks: Key single candle lines include Marubozu (no shadows), Spinning Tops (small bodies, long shadows), and Doji (open and close nearly equal), each reflecting unique market psychology.
- Visual advantage: Candlesticks offer a clearer, more immediate interpretation of price action and sentiment than standard bar charts.
- Data requirements: The book emphasizes the use of daily open, high, low, and close prices, with special handling for missing data to preserve gap information.
4. How does "Candlestick Charting Explained" by Gregory L. Morris define and validate candlestick pattern reliability?
- Pattern frequency and accuracy: Candlestick patterns appear about every 9 trading days, with reversal patterns making up 74% of occurrences; some patterns exceed 60% accuracy.
- Statistical analysis: The book provides detailed statistics on pattern frequency, win rates, average gains/losses, and net profit/loss ratios.
- Prediction intervals: Short-term predictions (1-5 days) are more reliable than longer-term ones, and knowing the trend improves pattern success rates.
- Confirmation categories: Patterns are classified by their need for confirmation, helping traders gauge reliability before acting.
5. What are the most important candlestick patterns and their messages in "Candlestick Charting Explained"?
- One-day patterns: Hammer, Hanging Man, Doji Star, and Marubozu signal indecision, reversal, or strong momentum, depending on body and shadow characteristics.
- Multi-day patterns: Engulfing, Harami, Morning Star, and Three Line Strike indicate stronger or confirmed reversals or continuations.
- Location matters: The significance of any pattern depends on its position relative to support and resistance levels.
- Pattern families: Learning patterns in groups helps traders recognize variations and related signals more effectively.
6. What is Sakata’s Method and its significance in "Candlestick Charting Explained" by Gregory L. Morris?
- Historical foundation: Sakata’s Method originates from 18th-century Japanese rice trading and forms the basis of candlestick analysis.
- Rule of three: It centers on formations like Three Mountains, Three Rivers, Three Gaps, Three Soldiers, and Three Methods, each representing specific market behaviors.
- Philosophical approach: The method combines price action with investor psychology, emphasizing trend continuation, pauses, and reversals.
- Structured interpretation: Sakata’s Method provides a systematic way to read and apply candlestick formations in trading.
7. How does Gregory L. Morris recommend identifying and confirming trends before using candlestick patterns?
- Trend identification first: The book stresses the importance of determining the prevailing trend before interpreting candlestick patterns.
- Use of moving averages: Short-term exponential moving averages (e.g., 10-day) are recommended for trend determination.
- Pattern context: The meaning and reliability of a pattern depend heavily on whether it appears in an uptrend, downtrend, or sideways market.
- Confirmation signals: Traders are advised to wait for confirmation from subsequent price action or technical indicators before acting on patterns.
8. What is candlestick filtering and how does Gregory L. Morris suggest using it in "Candlestick Charting Explained"?
- Filtering concept: Candlestick filtering involves using technical indicators (like RSI, Stochastics, MACD) to confirm candlestick signals and reduce false positives.
- Improved results: Filtering reduces the number of trades but increases average gain per trade, enhancing overall profitability.
- Practical application: The book provides case studies showing how filtering with indicators outperforms using candlesticks or indicators alone.
- Risk management: Filtering helps manage risk by avoiding premature or weak signals.
9. How does "Candlestick Charting Explained" by Gregory L. Morris integrate candlestick analysis with Western technical analysis?
- East-West synergy: Candlesticks reveal short-term sentiment, while Western charts highlight support, resistance, and longer-term patterns.
- Complementary tools: Combining both methods gives a fuller picture of market behavior and improves entry and exit timing.
- Confirmation at pivot points: Candlesticks are especially useful for reading trader attitude at key market turning points and confirming Western signals.
- Not a standalone system: The book cautions against relying solely on candlesticks, advocating for a blended approach.
10. What is CandlePower and how does volume play a role in candlestick analysis according to Gregory L. Morris?
- CandlePower method: CandlePower incorporates volume into candlestick analysis by varying candle width according to trading volume.
- Volume as confirmation: High volume on reversal or continuation days strengthens the reliability of candlestick signals.
- Volume patterns: Large volume often indicates strong conviction behind a move, while low volume may signal weak or unreliable patterns.
- Enhanced signal reliability: Integrating volume helps traders better assess the strength of price movements.
11. How does "Candlestick Charting Explained" by Gregory L. Morris address the role of human psychology in candlestick patterns?
- Trader emotions visualized: Candlestick patterns capture the collective psychology of market participants, including fear, greed, and indecision.
- Patterns as psychological snapshots: Each pattern reflects trader sentiment and decision-making at critical market moments.
- Trend context is key: Understanding the preceding trend is essential, as it sets the psychological stage for pattern development.
- Behavioral insights: The book emphasizes that candlesticks offer a unique window into short-term market psychology.
12. What are the practical trading tips and best practices from "Candlestick Charting Explained" by Gregory L. Morris?
- Use confirmation wisely: Some patterns require confirmation (e.g., Harami), while others (e.g., Engulfing) can be acted on more decisively.
- Combine methods: Integrate candlestick analysis with other technical and fundamental tools for a comprehensive trading strategy.
- Manage risk: Use filtering and confirmation to reduce false signals and avoid overtrading.
- Pattern recognition skills: Study patterns in families and practice disciplined application to improve recall and trading performance.
Download PDF
Download EPUB
.epub digital book format is ideal for reading ebooks on phones, tablets, and e-readers.








