

Key Takeaways
Add candlesticks to your chart, not in place of sound analysis
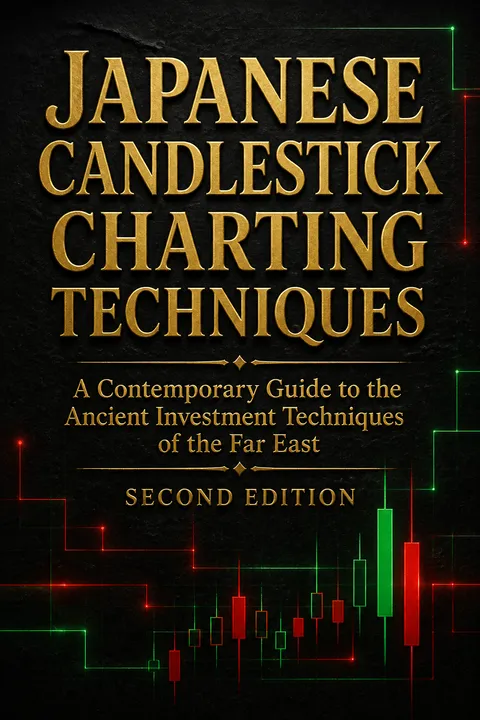
An extra market lens. Candlestick charts use the same open, high, low, and close as bar charts, but make the relationship between opening and closing prices easier to see. Steve Nison presents them as an additional source of evidence, not a replacement for trendlines, moving averages, or other technical tools. Their distinctive contribution is a visual account of buying and selling pressure within each period.
From rice to markets. The book traces Japanese charting to Munehisa Homma, an 18th-century rice trader who studied old prices, weather, and trader psychology. Osaka's rice warehouse receipts became early futures contracts, creating a market where price patterns mattered. Candlestick charting grew from this trading tradition, though its signals still require interpretation and confirmation.
The book's most durable proposition is methodological: add a new representation of familiar data, then compare its message with other evidence. A candle can make the struggle between opening and closing prices more legible, but it cannot reveal every cause behind a move. The Homma story also reminds readers that charting is a response to markets shaped by expectations as well as physical supply. The useful question is not whether candles are superior to bars, but whether their added visual detail improves a decision without encouraging false certainty.
Read each candle's body and shadows as a compact market argument
Body shows the contest. A candlestick's real body is the range between its open and close. A white body means the close was higher than the open; a black body means it was lower. The thin lines above and below, called shadows, mark the session's high and low. A long body signals a decisive move between open and close, while a small body suggests neither side finished with clear control.
Opening and closing matter. The open reflects the market's first response to overnight information; the close matters to traders who assess positions at day's end. When the open and close are equal, or nearly so, the candle is a doji. It records indecision, but its significance depends on context: a doji after a strong move matters more than one in a choppy range.
This visual language is useful because it separates two questions that a single closing price can blur: how far prices traveled, and where they ended relative to where they began. A long shadow records a failed excursion, while a long body records a sustained move between the session's endpoints. Neither proves that buyers or sellers will remain in control. Candles are best treated as concise descriptions of observed behavior, not as motives or guarantees.
Treat reversal candles as warnings that a trend may change
A reversal is not always a flip. The book uses reversal patterns to flag a likely change in the existing trend, not to promise an immediate move in the opposite direction. A rising market may turn sideways after a warning, for example, rather than collapse. A hammer is a small body near the top of the range with a long lower shadow, appearing after a decline. The same shape after a rally is a hanging man, a potential top signal that needs bearish confirmation.
Watch who takes control. In a bullish engulfing pattern, a large white body covers the previous small black body. A bearish engulfing pattern reverses that relationship after an advance. Dark-cloud cover and piercing patterns also compare two sessions: one side opens strongly, but the other pushes the close deep into the previous body's range.
The distinction between a trend change and a full reversal prevents a common interpretive mistake: treating every warning as an order to take the opposite position. The patterns are most informative as evidence that the previous side may have lost its easy advantage. Their shapes also encode failed follow-through, which is more useful than a label alone. Since the rules allow some variation, traders need consistent confirmation and exit criteria rather than selecting whichever interpretation fits a preferred position.
Use doji and stars to recognize when conviction has drained
Small bodies can speak loudly. A star is a small real body that gaps away from a preceding long body. It suggests the force behind the previous move has weakened. A morning star is a three-candle bottom pattern: a long black body, a small body after a downward gap, then a strong white body that advances into the first candle's range. An evening star is the bearish counterpart after a rise.
Doji raise the stakes. When the middle candle is a doji, the formation becomes a morning or evening doji star. A doji after a long white candle can warn that buyers have lost conviction, especially after an extended advance. A harami offers a related clue: a small body contained within the previous large body. A doji in that position forms a harami cross, a stronger warning of possible trend change.
These patterns focus attention on a change in conviction, not simply on whether a price is high or low. The sequence matters: a small pause after a forceful move, followed by a meaningful push the other way, tells a clearer story than either candle in isolation. Yet doji are common in some markets and time frames, so their value varies. The book's insistence on context is essential: an indecision signal in a quiet range is not the same event as one after a steep rally.
Let windows reveal continuation, then watch them become price barriers
A window is a gap. Japanese chartists call a gap a window. A window in a rising market generally suggests continued strength; one in a falling market points to continued weakness. The area of the gap can also become support or resistance. A pullback to an upward window may find buyers there, while a rally to a downward window may meet sellers. If prices cross the window and keep moving, the earlier trend signal has been undermined.
Pauses can resolve into breaks. The rising and falling three methods patterns describe a strong candle followed by several smaller candles that remain within its range, then a renewed move in the original direction. High-price and low-price gapping plays similarly show a short consolidation followed by a breakout. The three advancing white soldiers can mark strengthening after stable prices, but weakening candles within that sequence call for caution.
The window idea gives a gap two roles: it is evidence of a forceful move, and a reference point against which later price action can be judged. That makes the chart easier to monitor after the initial signal. The practical discipline is to distinguish an open gap from one that has been crossed and followed by continued movement. Continuation patterns also show why a pause need not mean reversal, although no formation eliminates the need to assess the larger market direction.
Trade a candle signal with the major trend, not against it
Direction sets the trade. A bearish pattern in a broader bull market may be a reason to reduce or protect a long position, not to initiate a short. A bullish pattern during a major decline may justify covering shorts, but does not automatically make buying sensible. The author recommends reading a signal alongside the prevailing trend and the price action that came before it.
Support and resistance add context. A pattern gains meaning when it appears at a significant level. The book's change of polarity principle says old support can become resistance after it breaks, and old resistance can become support after it is overcome. A hammer at established support, or a dark-cloud cover at former support that now acts as resistance, combines candle information with a price level.
This rule makes candlestick analysis less reactive. A local pattern is a short-term observation; the larger trend describes the environment in which it must be interpreted. Treating those time scales separately helps prevent a brief countertrend bounce from being mistaken for a new market direction. Support and resistance are also not fixed properties of a price. Their changing role reflects how market participants respond after a level has been crossed, making retests especially informative.
Require independent evidence when a chart signal carries real risk
Look for a confluence. The book calls agreement among separate technical tools the Rule of Multiple Techniques. For example, a candlestick reversal at a trendline or retracement level may be more persuasive than either signal alone. Nison illustrates this with gold: several methods pointed to resistance between about $425 and $433, including a 50% retracement, a measured move from a double bottom, an earlier high, and an Elliott Wave count. Gold turned near that zone.
Confirmation is not certainty. Moving averages, trendlines, retracements, Elliott Wave counts, and Market Profile can all provide different views of price behavior. The practical aim is to see whether they identify a similar decision area. The methods can disagree, and some, especially pattern counts, require judgment. Agreement strengthens a case; it does not make a forecast infallible.
The gold example is memorable because the forecast did not depend on one elegant pattern. Several independent calculations converged on a narrow price region, then the market's response there supplied a test. This is a useful model of technical reasoning: specify in advance what evidence would support a view and what price behavior would invalidate it. There is still a risk of confirmation bias if analysts count only the tools that agree. A strong process also records conflicting evidence and defines what would prove the interpretation wrong.
Use volume and open interest to judge whether price has backing
Price needs participation. Volume can help assess the force behind a move. Rising volume alongside a trend supports the idea that participation is increasing; declining volume during an advance or decline can suggest the move is losing energy. A light-volume test of a previous low may indicate that selling pressure has eased. The book's examples pair such evidence with candles, such as a reversal pattern at a retested level.
Open interest adds another clue. In futures, open interest counts outstanding contracts, not the number of trades. Rising open interest during a rising market is treated as support for the advance; falling open interest can mean the move relies on existing traders exiting positions. The book also discusses RSI, stochastics, and momentum, which can flag divergence when prices make new highs or lows without comparable confirmation from the indicator.
These measures ask whether a price move is being reinforced by participation, rather than relying on the candle's shape alone. That is a valuable distinction, especially when a visually dramatic session occurs on little activity. But volume, open interest, and oscillators are supporting evidence, not direct access to trader intentions. Their readings can be distorted by contract structure, timing, or the chosen calculation period. The sound practice is to use them to qualify a price signal, not to replace price with a more complicated indicator.
Set protective exits before a convincing pattern makes you stubborn
Risk belongs in the plan. Nison treats a stop as part of the trade, set while the trader is still objective. A stop can be placed beyond the level that would contradict the pattern or the supporting evidence. If the market reaches it, the original reading has failed enough to leave. The book's examples repeatedly show that even well-formed patterns sometimes do not work.
Candles can guide hedges, too. A producer worried about falling prices or a buyer exposed to rising prices can use candlestick signals to time or adjust a futures or options hedge. Options limit the buyer's loss to the premium paid, though their value also depends on time and volatility. The aim of a hedge is to manage cash-price exposure, not to turn the hedge itself into a speculative profit target.
The risk lesson follows directly from the book's emphasis on imperfect signals: a pattern is useful only if the trader knows what to do when it fails. Precommitting to an exit limits the temptation to reinterpret adverse prices as temporary noise. Hedging extends the same logic beyond speculation, since timing affects how much exposure is protected. Neither stops nor options remove risk; they make some risks more explicit. That clarity is more valuable than pretending a chart can deliver certainty.
Tune pattern rules to the market instead of demanding textbook shapes
Patterns are guideposts. The ideal diagrams are teaching aids, not templates that every real chart must match. A dark-cloud cover or hammer may be imperfect yet still matter when supported by the surrounding price action. Conversely, a perfect-looking candle in the middle of an uneventful range may mean little. The author notes that definitions can vary and that the importance of a pattern depends on the market, the time frame, and the trader's approach.
Test your own market. Nison describes how chartists can learn which patterns and variations recur in their markets. Candlestick signals also depend on the close, so a valid daily pattern may not be complete until the session ends. In some cases, an hourly chart offers earlier evidence, but it does not erase the need to confirm the daily signal or manage the risk of acting early.
Flexibility is necessary in chart reading, but it creates a methodological hazard: after a move, almost any shape can be explained as a signal. The remedy is not rigid pattern policing, but explicit criteria and records made before outcomes are known. Tracking a pattern by market and time frame can separate useful variations from attractive hindsight. The book's visual vocabulary is most powerful when paired with that discipline, because subjective interpretation then becomes something that can be examined rather than merely asserted.
Analysis
Japanese Candlestick Charting Techniques is both an introduction to a chart language and an argument for combining analytical lenses. Its organizing idea is simple: the opening, high, low, and close already used in Western charts can be rendered in a way that makes the session's internal struggle more visible. From there, the book builds a practical vocabulary of reversal and continuation patterns, then shows how to test those signals against trends, support and resistance, volume, open interest, retracements, oscillators, and other tools.
The book's greatest strength is its insistence on context. A hammer is not automatically a buy, a doji is not automatically a top, and a reversal signal need not produce a reversal. This resists the common urge to convert visual recognition into certainty. Its account of Munehisa Homma and the rice markets gives the methods historical depth, while the examples make them concrete across markets and time frames.
The central limitation is evidentiary. The book supplies many illustrative charts and trading interpretations, but examples do not establish how reliably a pattern performs across all markets, periods, and trading costs. The rules also permit subjectivity: thresholds such as what counts as a long body, a high-price area, or sufficient confirmation may vary. That flexibility makes the tools adaptable, but makes hindsight especially tempting.
The most useful way to read the book is as a disciplined vocabulary for describing price behavior, not a self-contained prediction machine. A pattern proposes a hypothesis about changing pressure. Trend, confluence, participation, and risk controls help evaluate it. The reader's task is to define signals consistently, notice when evidence conflicts, and decide in advance what would invalidate a trade. Candlesticks add detail to analysis; judgment determines whether that detail deserves action.
People Also Read





Glossary
Real body
Open-to-close rangeThe thick portion of a candlestick, bounded by the session's opening and closing prices. A white or empty body indicates that the close was higher than the open; a black or filled body indicates that the close was lower. Its size shows how far the market moved between those two emotionally important points.
Shadow
Session price extremeThe thin line above or below a candlestick's real body. The upper shadow runs from the body to the session high, while the lower shadow runs from the body to the session low. Together, they show how far prices traveled beyond the opening-to-closing range before the session ended.
Doji
Open-close indecisionA candlestick in which opening and closing prices are equal or nearly equal. Its shadows may be short or long, producing different forms such as the long-legged doji or gravestone doji. A doji expresses balance or hesitation for that session. Its potential importance depends on its position in a trend and whether later price action confirms a change.
Harami
Small body inside largeA two-candlestick pattern in which a small real body sits within the previous session's unusually large real body. It suggests that the immediately preceding trend has lost momentum and that buyers and sellers have reached a temporary balance. The second body's color is not decisive. When the smaller body is a doji, the pattern is called a harami cross.
Window
Japanese name for gapA gap between one session's price extremes and the next session's extremes. Japanese chartists treat a window as a continuation clue: an upward window favors further strength, while a downward window favors further weakness. The gap area can also become support or resistance on a later return. Continued movement through a window challenges its original implication.
Rule of Multiple Techniques
Seek technical confirmationThe principle of giving greater weight to a market signal when separate technical methods point to the same price area or conclusion. A candlestick reversal might coincide with a trendline, retracement level, moving average, or measured target. Agreement can strengthen a forecast, but does not guarantee it, and conflicting evidence should not be ignored.
Change of polarity principle
Levels switch rolesThe observation that broken support can become resistance and broken resistance can become support. Traders watch how prices behave when they return to the old level. The principle is more significant when the level was tested repeatedly or saw substantial trading activity. Candlestick patterns can help show whether the retest is holding or failing.
Spring
Failed break below supportA bullish setup in which prices break below support in a sideways trading range, then recover above the old support level. The failure to hold new lows suggests that selling pressure has not taken control. A trader may look for a move toward the opposite side of the range, while placing a protective stop below the new low.
Upthrust
Failed break above resistanceA bearish setup in which prices move above resistance in a sideways range but fail to hold those new highs, returning below the former resistance. The failed breakout suggests that buyers could not establish a foothold above the range. The opposing side of the range can be a target, with a protective stop above the failed breakout high.
Tick Volume
Trades per time intervalA count of the number of trades completed during an intraday interval. It can offer a timely indication of trading activity when official futures volume is not yet available. Unlike contract volume, it does not show how many contracts were included in each trade, so it is an imperfect measure of participation.


Download PDF
Download EPUB
.epub digital book format is ideal for reading ebooks on phones, tablets, and e-readers.








