

Key Takeaways
Track proportions, not raw totals, when chance repeats
The denominator matters. During World War II, mathematician John Kerrich tossed a coin 10,000 times while interned in Denmark. Heads appeared 5,067 times, 134 more than tails. The raw gap grew, but the proportions moved close to 50 percent each. The Law of Averages describes this convergence in relative frequency, not a promise that raw counts will equalize or that a bad run must be followed by a good one.
Look beyond a few trials. With only ten tosses, a near-even split is common, which can make the wrong interpretation feel intuitive. The same principle applies to risks: a count of incidents means little without the number of people or opportunities involved.
This is a powerful corrective because people naturally notice counts before rates. A report of dozens of adverse events can sound alarming until the exposed population is known. Yet choosing the denominator is itself a judgment: comparing risks across groups may require accounting for age, exposure time, or other relevant differences. A rate is more informative than a raw total, but it is not automatically a fair comparison.
Assume randomness can create startling patterns by chance
Surprise is not proof. In a group of just 23 people, the chance that at least two share a birthday exceeds 50 percent. That is because there are many possible pairs, not because any one person’s birthday is especially likely to match yours. Likewise, a Florida lottery once drew five consecutive numbers. The chance of that particular-looking pattern was about 1 in 12,000, far from impossible across frequent draws.
Count the search space. People notice striking coincidences after they happen, while ignoring countless ordinary events that could have caught their attention. This makes “amazing” hard to define in advance. The more patterns people could have noticed, the less impressive any one discovery may be.
The useful shift is from asking whether a coincidence is rare to asking how many ways a surprising event could have been noticed. This resembles the multiple-comparisons problem in research: searching many outcomes makes an apparently unusual result easier to find. The point is not that coincidences never matter. It is that their significance needs a comparison with the full range of opportunities, not just the memorable one.
Don't multiply probabilities until independence is justified
Events can share a cause. A report that six eggs in one carton all had double yolks sounds impossibly unlikely if each egg is treated as independent and the average rate is 1 in 1,000. But the carton may contain eggs from young hens, which are much more prone to double yolks. Large eggs can also be sorted together. Once one egg is unusual, the others in its carton are more likely to be unusual too.
Separate sequence from cause. A video game being common among teenagers who die by suicide does not establish that the game caused the deaths. A useful comparison asks how common the game is among teenagers who do not die by suicide. When a suspected cause or effect is widespread, chronology and anecdotes alone are especially weak evidence.
Independence is not a harmless mathematical convenience when the real world contains shared environments, selection, and common causes. A family, school, or workplace can produce clusters without each event directly causing the next. The same logic protects against premature causal claims. Still, dependence can be difficult to detect, especially when the relevant common cause is unmeasured. A calculation can expose assumptions, but it cannot identify every hidden link by itself.
Use random assignment to neutralize causes you cannot name
Let chance balance groups. Random allocation helps researchers compare a treatment group with a control group without having to identify every factor that could affect the outcome. In a 1947 British trial of streptomycin for tuberculosis, about 100 patients were assigned to antibiotics or the existing bed-rest treatment. After six months, the survival rate in the antibiotic group was nearly four times higher.
Randomness has limits. Randomized controlled trials can still recruit unrepresentative participants, lose people who drop out, or produce results that do not transfer to everyday settings. Observational studies remain necessary when assigning a possible danger, such as smoking or a risky diet, would be unethical. Their results need more caution because groups may differ in ways researchers have not measured.
Random assignment is a method for reducing confounding, not a guarantee that a study answers every question. It strengthens causal inference inside the trial while leaving open who was able or willing to enroll and whether the treatment works under ordinary conditions. This distinction is central to evidence-based policy: a rigorous test can establish that something worked for a studied group without establishing that it will work equally well everywhere.
Treat exceptional results as temporary until repeated evidence arrives
Extremes often fade. Regression to the mean is the tendency for unusually high or low performance to move closer to its typical level when later measurements include fresh random variation. A struggling sports team may improve after a manager is fired simply because its worst run was unlikely to continue. The improvement alone does not prove the new manager caused it.
Beware the hot streak. Economist Burton Malkiel examined the 20 best-performing equity funds from 1990 to 1994. They beat the S&P 500 by an annual average of 9.5 percent, then underperformed the market by more than 2 percent a year over the following five years. Outstanding performance is worth investigating, but one exceptional stretch is poor evidence of lasting skill.
Regression to the mean is a useful defense against stories that assign a cause to every reversal. It encourages longer observation and comparison with a baseline. It should not become an excuse to dismiss genuine improvement: performance can change because of skill, policy, or new conditions. The distinction requires evidence beyond the sequence itself, such as comparable teams or funds that did not receive the intervention.
Add diverse judgments when one expert's forecast is fragile
Pool different information. In 1906, Francis Galton analyzed guesses made at a livestock exhibition about an ox’s dressed weight. The median guess was 1,208 pounds, close to the actual 1,197 pounds. The result illustrates the Wisdom of Crowds effect: a group’s combined estimate can be accurate when participants bring useful, varied judgments.
Diversity matters more than headcount alone. Prediction markets turn forecasts into tradable estimates, giving participants an incentive to reveal what they believe. A study of the Iowa Electronic Market found it beat conventional polls about three-quarters of the time in presidential elections, with forecast errors around 1 percent. A crowd of people drawing on the same information can still share the same blind spot.
Collective judgment works best when errors are not all correlated. Adding more people who rely on the same source may amplify a shared mistake rather than cancel individual errors. Diversity can help, but it does not eliminate poor incentives, misinformation, or strategic behavior. The practical lesson is to ask not only how many people contribute, but whether they have genuinely different evidence and perspectives.
Price a risk by its probability and its consequences
Calculate expected value. Expected value is the average payoff implied by an outcome’s probability and its consequences. A 20 percent chance of winning £100 has an expected win of £20 before considering the cost of the bet. The same arithmetic helps assess insurance: a £349 television with a 5 percent chance of failure over five years has an expected replacement cost of about £18, not a £99 warranty premium.
Money has diminishing utility. Daniel Bernoulli developed utility, a measure of how valuable money feels in context, to resolve the St Petersburg Paradox, a game whose theoretical expected payout is infinite. A person’s willingness to risk money depends not only on average payoff but also on what a loss would mean. Insurance against a devastating loss can be sensible even when the event is unlikely.
Expected value disciplines intuition, but it does not settle every decision. People differ in wealth, risk tolerance, and ability to absorb a loss, so the same calculated bet can be reasonable for one person and disastrous for another. The distinction between a replaceable gadget and a ruinous medical bill captures why probability cannot be separated from consequence. Insurance also buys services and peace of mind, benefits that a simple payout calculation may miss.
Update belief with evidence, but compare both explanations
Start with the prior. Bayes’s Theorem describes how evidence should change an existing level of belief. It weighs how likely the evidence would be if a claim were true against how likely it would be if the claim were false. That comparison is the Likelihood Ratio. A positive test matters only in relation to both its error rates and the prior chance of the condition.
Base rates change diagnoses. For a woman in her sixties, the book gives a breast-cancer prevalence of about 5 percent and a mammogram sensitivity and specificity of roughly 80 percent. Among 100 similar women, about four true positives and 19 false positives are expected. So a positive result implies about a 17 percent chance of cancer, not an 80 percent chance. Further testing is warranted, but panic is not.
Bayesian reasoning makes the hidden comparison explicit: evidence is informative only when it is more expected under one explanation than another. This guards against confusing a test’s performance among people with a condition with the chance that a person testing positive has it. Priors can be contentious, especially when evidence is sparse, so good analysis makes them visible and tests whether conclusions change under reasonable alternatives.
A significant result is not proof, nor a probability of truth
Read the p-value carefully. A p-value measures how likely results at least as extreme as the observed ones would be if a specified no-effect model were true. It does not tell researchers the probability that their finding is false. Yet the conventional 5 percent threshold is often treated as if it did, helping weak or accidental results appear decisive.
Replication tests durability. Small studies, many comparisons, publication bias, and selective analysis can produce findings that look compelling but fail to recur. The book describes growing replication problems across fields and notes that some research claims disappear when tested again. A result that passes a threshold is a reason to investigate, not a substitute for repeated evidence, sound methods, and practical importance.
The distinction is essential, but criticism of p-values should not imply that every frequentist method is worthless. A p-value can answer a narrow question when the study design and analysis are appropriate. The deeper failure is asking it to answer a different question, such as whether a hypothesis is probably true. Replication, transparent analysis, and effect sizes make scientific claims more informative than a pass-or-fail label alone.
Check the tail before trusting a model of rare events
Normal is an assumption. The Central Limit Theorem explains why many independent influences can produce a Bell Curve, but it does not say that every real-world variable follows one. Financial losses, natural disasters, and other extreme outcomes may have much heavier tails, making rare events far more common than a Normal model predicts. The book contrasts a 25-sigma event, effectively impossible under a Bell Curve, with a vastly more plausible estimate under a Cauchy distribution.
Model extremes directly. Extreme Value Theory uses data on unusually large or small events to estimate tail risks. It can inform flood defenses and insurance, but its forecasts depend on the quality of historical data and the stability of the process. A precise-looking answer is not protection against a changing climate or a poorly chosen model.
Tail assumptions matter most where the cost of being wrong is largest. A model can fit ordinary observations well while badly understating catastrophic outcomes, because the data contain few examples of the events that matter most. Extreme-value methods improve the question, but they cannot manufacture certainty from a short or changing record. Good risk practice pairs quantitative estimates with safeguards against model failure.
Treat financial models as maps with expiring assumptions
Data do not explain themselves. Google Flu Trends used vast search data and hundreds of millions of candidate models, yet its forecasts missed an outbreak and often overestimated flu activity. More observations cannot rescue biased inputs, excessive searching, or a model that mistakes correlation for a stable relationship.
Markets change their rules. Modern Portfolio Theory uses historical returns, variability, and correlations to propose an efficient mix of assets. Those inputs can shift, especially in a crisis. The book argues that low-cost index funds and patient holding can outperform costly attempts to pick winners, but neither strategy guarantees a smooth ride or protection from a major decline. Models can guide choices; they cannot abolish uncertainty about the future or themselves.
The model is not merely a simplified picture of reality. It is also a claim that the relationships it captures will remain useful. That claim deserves its own scrutiny, particularly when incentives reward confidence and complexity. Passive investing is not a forecast that markets will always rise; it is a way to reduce fees and avoid some costly attempts to outguess them. Simplicity can limit certain errors, not uncertainty itself.
Analysis
The book’s strongest unifying idea is that probability is not a machine for removing uncertainty. It is a discipline for locating uncertainty, naming assumptions, and choosing actions despite incomplete knowledge. The recurring practical move is to replace an intuitive story with a comparison: counts with rates, a positive diagnosis with its base rate, an apparent cause with a control group, or an extraordinary result with what would happen under competing explanations. This gives the book an unusually coherent arc across gambling, medicine, science, and finance.
Its most valuable distinction is between chance as repeatable randomness and probability as a measure of belief. The first supports frequency estimates; the second supports evidence updates. Confusing them helps explain why people misunderstand streaks, tests, and scientific findings. Bayesian reasoning provides a common language for updating beliefs, but it does not make judgment disappear. Prior assumptions matter, especially with sparse data, and model choices can shape what counts as evidence. The book is most persuasive when it asks readers to expose those choices rather than promising that one method settles every dispute.
Some arguments need careful scope. A p-value is not the probability a claim is false, but it can be meaningful as a calibrated measure under a defined model and sound design. Likewise, random assignment improves causal comparison within a study but cannot guarantee that participants represent a wider population. Extreme Value Theory addresses tail behavior, yet historical extrapolation remains fragile when the underlying process changes. These qualifications sharpen rather than weaken the central message: no statistical tool is self-interpreting.
The book’s most durable advice is therefore procedural. Ask what the denominator is, what information is missing, what assumptions link the data to the conclusion, and what happens if the preferred model fails. Probability becomes useful not because it offers certainty, but because it makes uncertainty legible enough to act on without pretending it has vanished.
Review Summary
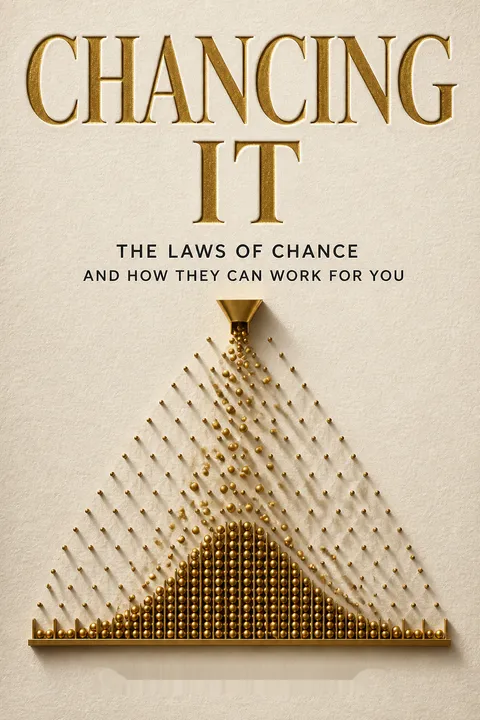
Chancing it the laws of chance and how they can work for you receives mostly positive reviews, praised for its accessible introduction to statistics and probability. Readers appreciate its clear explanations of complex concepts, historical context, and real-world applications. Some find it challenging or too technical, while others value its insights into statistical pitfalls and Bayesian methods. The book is compared favorably to similar works and recommended for those interested in understanding probability and its implications in various fields, from science to finance.
People Also Read







Glossary
Law of Averages
Long-run frequency convergenceThe principle that, across many repetitions of a chance process, the relative frequency of an outcome tends toward its probability. It does not say that raw counts will become equal or that a run of one result makes the opposite result more likely next time.
Laws of Lawlessness
Rules for interpreting chanceThe book’s label for three principles: judge chance outcomes by relative frequencies rather than raw counts, do not assume real-world events are independent, and recognize that random samples can contain striking patterns. Together, they caution against treating anecdotes, coincidences, or short runs as self-explanatory evidence.
Regression to the mean
Extremes tend to moderateThe tendency for an unusually high or low measurement to be followed by one closer to the typical level, partly because random variation rarely remains extreme. It can make an ineffective intervention seem successful when it follows a bad run, or make a temporary success look like lasting skill.
Wisdom of Crowds effect
Group estimates can be accurateThe finding that the combined judgment of a group can be closer to the truth than many individual judgments. Accuracy depends on more than group size: participants need useful information and sufficiently diverse perspectives. When their errors or information sources are strongly correlated, a crowd can share and amplify the same mistake.
Bayes's Theorem
Updates belief with evidenceA rule for revising the probability of a claim after observing evidence. It combines an initial probability, called the prior, with the evidence’s comparative likelihood under the claim and its alternatives. The theorem applies to diagnostic tests, scientific hypotheses, and other situations where evidence changes what is reasonable to believe.
Likelihood Ratio
Evidence strength comparisonThe ratio between the probability of observing evidence if a hypothesis is true and the probability of observing it if the hypothesis is false. A ratio above one supports the hypothesis, a ratio below one weakens it, and a ratio of one contributes no evidence either way.
p-value
Data extremity under a nullThe probability, assuming a specified null model is correct, of obtaining results at least as extreme as those observed. It is not the probability that the null hypothesis is true or that the finding is a fluke. Its interpretation depends on the design, analysis, and assumptions used to calculate it.
Central Limit Theorem
Conditions for bell-shaped averagesA mathematical result explaining why the combined effect of many suitably behaved, independent influences often approaches a Normal, bell-shaped distribution. It is widely useful in statistics, but it does not establish that all observed data are Normally distributed, especially when influences are dependent or extreme outcomes are important.
Extreme Value Theory
Models rare extremesA branch of probability and statistics focused on the largest or smallest outcomes in a data set, such as severe floods or unusually large financial losses. It can estimate risks beyond ordinary observations, but its estimates depend on suitable extreme-event data and assumptions about how the underlying process behaves.
Modern Portfolio Theory
Optimizes diversified portfoliosA mathematical framework for choosing a mix of investments by comparing their expected returns, variability, and correlations. It formalizes the potential benefits of diversification, but relies on historical inputs and assumptions about risk that may not hold in future markets, particularly during crises.
FAQ
What's Chancing It: The Laws of Chance and How They Can Work for You about?
- Exploring Probability: The book delves into the principles of probability and their impact on everyday life, decision-making, and scientific research.
- Real-Life Applications: It illustrates how understanding probability can aid in contexts like gambling, insurance, medical diagnoses, and investment strategies.
- Engaging Narrative: Robert Matthews combines personal anecdotes, historical examples, and scientific insights to create an engaging narrative for both specialists and non-specialists.
Why should I read Chancing It by Robert Matthews?
- Practical Decision-Making: The book equips readers with tools to make rational decisions in uncertain situations, relevant in today's complex world.
- Clear Explanations: Matthews explains complex mathematical concepts in an accessible manner, making it suitable for readers without a strong math background.
- Timely Insights: It provides a framework for evaluating claims and making informed decisions based on evidence and probability, crucial in an era of misinformation.
What are the key takeaways of Chancing It?
- Law of Averages: The book clarifies misconceptions about the Law of Averages, emphasizing relative frequencies over raw numbers.
- Bayesian Methods: Matthews highlights the importance of Bayesian probability for updating beliefs based on new evidence.
- Critical Thinking: It encourages questioning common assumptions about chance and risk, promoting a more analytical approach to decision-making.
How does Chancing It explain Bayesian methods?
- Bayesian Probability Defined: Matthews introduces Bayesian methods as a way to update beliefs based on new evidence, contrasting with traditional probability.
- Practical Applications: The book illustrates applications in fields like medicine and finance, showing how Bayesian methods improve decision-making.
- Likelihood Ratio: Emphasizes the importance of the Likelihood Ratio in Bayesian analysis for quantifying evidence strength.
What is the Law of Averages as explained in Chancing It?
- Misconceptions Addressed: Matthews clarifies that the Law of Averages refers to relative frequencies becoming predictable with more trials, not outcomes balancing out.
- Focus on Frequencies: The key takeaway is to concentrate on event frequencies relative to opportunities, essential for interpreting probabilistic scenarios.
- Real-World Examples: Uses experiments like coin tosses to demonstrate how the Law of Averages operates, showing randomness can lead to surprising short-term outcomes.
How does Chancing It critique traditional statistical methods?
- Limitations of Significance Testing: Matthews argues that significance testing often leads to false conclusions and lacks consideration of prior knowledge.
- Frequentist vs. Bayesian: Contrasts frequentist methods with Bayesian approaches, highlighting the latter's incorporation of prior beliefs for more reliable conclusions.
- Call for Change: Advocates for a shift towards Bayesian methods in research and decision-making for more accurate insights.
What are some real-world applications of Bayes's Theorem discussed in Chancing It?
- Medical Diagnoses: Illustrates how Bayes's Theorem improves diagnostic accuracy by updating disease probabilities based on test results.
- Search Operations: Uses the US Coast Guard's search for a missing fisherman to demonstrate decision-making guided by Bayesian updates.
- Cryptography: Discusses Alan Turing's use of Bayes's Theorem in code-breaking during WWII, showcasing its practical significance.
What is the "Problem of Priors" in Bayesian analysis?
- Definition: Refers to the challenge of establishing initial beliefs or probabilities before considering new evidence.
- Impact on Analysis: Without well-defined priors, Bayesian analysis results can be subjective and misleading.
- Addressing the Problem: Discusses strategies like using historical data or expert opinions to inform initial beliefs, enhancing analysis reliability.
What are some common misconceptions about probability discussed in Chancing It?
- Gambler’s Fallacy: The belief that past events influence future outcomes in independent trials is debunked; probabilities remain constant.
- Diagnostic Test Misinterpretation: Many overestimate condition likelihood based on accuracy rates without considering base rates; context is crucial.
- Randomness Equals Patternlessness: Clarifies that randomness can produce patterns over short sequences, misleading individuals into seeing trends.
What are the best quotes from Chancing It and what do they mean?
- Empowerment Through Understanding: "While we can never be free of chance, risk, and uncertainty, they all follow rules which can be turned to our advantage."
- Focus on Frequencies: "When trying to make sense of chance events, ignore the raw numbers. Focus instead on their relative frequency."
- Limitations of Certainty: "The dirty secret lurking in Bernoulli’s Golden Theorem is that when trying to gauge the effects of chance, God-like certainty is unattainable."
How does the author use historical examples to illustrate concepts in Chancing It?
- Alan Turing's Work: Turing's application of Bayes's Theorem in WWII code-breaking highlights its practical significance.
- US Coast Guard Search: Demonstrates the iterative process of updating beliefs with new evidence in real-world scenarios.
- Medical Case Studies: References medical studies to show Bayes's Theorem's impact on improving diagnostic accuracy.
How can I apply the concepts from Chancing It in my daily life?
- Evaluate Risks and Rewards: Use expected value and probability principles to assess decisions, from investments to health choices.
- Question Assumptions: Challenge common beliefs about chance and risk, seeking to understand underlying probabilities for better decision-making.
- Embrace Bayesian Thinking: Apply Bayesian methods to update beliefs with new information, allowing for continuous learning and adaptation.
Download PDF
Download EPUB
.epub digital book format is ideal for reading ebooks on phones, tablets, and e-readers.








