

Key Takeaways
Build understanding by implementing data science before outsourcing it to libraries.
Data science joins skills. Grus frames the field as extracting insight from messy data through programming, mathematics and statistics, plus knowledge of the subject being studied. The DataSciencester examples turn ordinary questions into computational tasks: identify influential network members, suggest connections, estimate salaries, and understand user interests. The recurring lesson is to make the reasoning visible in code, not to treat an algorithm as a magic answer.
Learn by rebuilding. The book implements tools such as vector arithmetic, regression, and neural networks in plain Python. These versions are deliberately small and slow. Their purpose is understanding: once the mechanics are clear, established libraries can handle real workloads.
The educational choice resembles learning physics by deriving a result before using a calculator. It builds a useful habit: ask what the software assumes, what its inputs mean, and what could make its answer misleading. The limitation is equally important. Hand-built algorithms are not automatically safer or more transparent in practice, and their toy-scale performance can mislead beginners about operational demands. The strongest payoff comes when a from-scratch implementation is treated as a mental model, not as a production recommendation.
Inspect, visualize, and clean data before asking it for answers.
Explore before modeling. A dataset’s average and range can conceal its shape. Grus contrasts uniform and normally distributed samples with nearly identical means and standard deviations: their histograms reveal that the values are distributed very differently. Scatterplots and correlation matrices help expose relationships across dimensions, while a misleadingly cropped bar-chart axis can make a tiny change look dramatic.
Assume the data is dirty. A stock-price file may contain a malformed number or a date in the year 3014. Parse rows in testable functions, check for missing values and implausible outliers, and decide whether to repair or exclude bad records. Rescaling matters too: measuring height in inches rather than centimeters can change distance-based results if dimensions are not put on comparable scales.
Exploration is not cosmetic preparation. It is a form of measurement control: before asking what a pattern means, analysts need to know whether the observed values represent the intended quantities. Visual checks are especially good at surfacing anomalies that a summary statistic hides. Yet visual inspection is not a substitute for systematic validation. A chart can reveal a suspicious point, but documented parsing rules and reproducible checks are what prevent the same error from returning unnoticed.
Choose statistics that match the shape and limits of your data.
Center is not the whole story. The mean uses every value, so a single extreme observation can pull it sharply. The median depends on the middle of the sorted data and resists that pull. In the book’s example, changing the friendliest user’s count from 100 to 200 raises the mean number of friends from about 7.33 to 7.82, while the median remains 6. The interquartile range, which spans the middle half of observations, is also less sensitive to a few outliers than standard deviation.
Relationships need context. Correlation measures linear co-movement, not causation, and a single outlier can change it substantially. Simpson’s paradox shows how an overall comparison can reverse within subgroups when a third variable, such as education, is distributed differently across groups.
The choice of summary statistic is an implicit choice about what kinds of variation deserve influence. Robust measures are valuable when extreme values may be errors or rare exceptions, while means remain meaningful when totals and averages are the actual question. The same care applies to correlation: aggregation can conceal subgroup structure, and an association can reflect selection or a shared cause. No single statistic is universally honest. The analyst’s responsibility is to state what it captures and what it leaves out.
Treat every result as uncertain, and design tests before peeking.
Probability clarifies evidence. Bayes’s theorem updates a prior belief using new evidence. With a disease affecting 1 in 10,000 people, even a test that is correct 99% of the time can produce positive results that are less than 1% likely to indicate disease when applied to people at random. The reason is the large number of healthy people who can test positive.
Testing has failure modes. A p-value asks how often data at least this extreme would arise under a specified null hypothesis. It is not the probability that the hypothesis is true. If analysts try enough hypotheses or selectively remove inconvenient observations, chance can produce apparently significant findings. Set hypotheses in advance, clean data without tailoring the choices to the desired result, and use randomized experiments when causal claims matter.
The base-rate example is a compact lesson in conditional reasoning: an impressive test result can still be weak evidence when the event is rare. It also explains why statistical communication should include the population and the decision context, not just a test’s accuracy. Pre-registration and randomized assignment address different problems: the first reduces flexible analysis, while the second helps identify causal effects. Neither eliminates uncertainty, but each makes the source of uncertainty easier to inspect.
Judge models on unseen cases, not how perfectly they memorize.
Separate learning from evaluation. Overfitting occurs when a model captures quirks of its training examples and performs poorly on new cases. A simple polynomial can miss the training pattern, while a very complex one can pass through every training point yet behave erratically between them. Split data into training and test sets; if the test set is also used to choose among many models, reserve a separate validation set as well.
Accuracy can flatter. In a hypothetical leukemia predictor that flags babies named Luke, about 98.1% of predictions are correct because most people do not develop leukemia. But its precision is only 1.4%, and its recall is 0.5%. Precision asks how often positive predictions are right; recall asks how many actual positive cases are found. Which matters more depends on the cost of each error.
Evaluation is a design problem, not a final ceremony. Reusing test data to select a model quietly turns it into training data, so a clean holdout is essential to an honest performance estimate. The Luke example also shows why a metric must be tied to a decision: false alarms and missed cases can carry very different consequences. Even a carefully held-out score may not predict performance after deployment if the population, incentives, or data collection process changes.
Match the model to the question, the features, and the costs of error.
Different tools encode different assumptions. K-nearest neighbors classifies a case using nearby labeled examples. It nearly classifies the Iris flower dataset correctly, but distance becomes less informative in high-dimensional spaces. Naive Bayes estimates a class from word evidence while assuming words act independently given the class. On email subject lines from the SpamAssassin corpus, this simple filter reached 77% precision and 65% recall.
Interpretability has value. Linear regression estimates how an outcome changes with numeric inputs; adding work hours and PhD status improved the DataSciencester model’s R-squared from about 0.33 to 0.68. Decision trees offer readable if-then paths, while neural networks can learn more complex combinations of features. Feature selection, scaling, and domain knowledge help determine which approach is sensible.
A model is a set of useful constraints on what patterns it can learn. That is why the question and the representation of its inputs matter as much as the algorithm’s name. A transparent tree may support scrutiny, while a flexible network may capture structure that a simple rule misses. Neither is inherently superior. The comparison should include the consequences of mistakes, the quality and meaning of the features, and whether the model must explain its decisions to people affected by them.
Use clustering and dimension reduction to expose structure, then check what they preserve.
Find patterns without labels. K-means clustering groups points around a chosen number of centers, repeatedly assigning each point to its nearest center and recalculating the centers. It can suggest meetup locations from user geography or reduce an image to five representative colors. The number of clusters is not revealed by the method; plotting total squared distance against the number of clusters can help identify a useful bend in the curve.
Compress with care. Principal component analysis, or PCA, finds directions that capture much of the data’s variation, then represents observations using those directions. This can reduce noise and simplify high-dimensional data. But components may be harder to interpret than the original features, and high variance is not automatically the same as practical importance.
Clustering and PCA are forms of compression: they turn complicated data into a smaller structure people can inspect or use. Their usefulness depends on the question. A color palette needs a compact visual approximation, while a medical or social category may require meanings that a distance metric cannot supply. The cluster count and distance measure encode choices, not discoveries of nature. A responsible analysis checks whether the simplified representation preserves the distinctions relevant to the task.
Language models learn patterns from context, including the limitations of their source text.
Context carries signal. An n-gram model predicts a word from nearby words observed in a source document. Bigrams can produce grammatical-looking fragments that quickly drift into nonsense; trigrams offer more context but may reproduce phrases from the original text. A grammar-based generator instead expands rules such as sentence, noun phrase, and verb phrase, with recursive rules allowing many possible sentences.
Representations inherit their evidence. Topic modeling groups words into latent themes, while word-vector models learn numeric representations from neighboring words. Words appearing in similar contexts tend to receive similar vectors. In a small artificial corpus, colors and adjectives cluster because the sentences place them in similar positions. That is a learned regularity of the corpus, not proof that the words are interchangeable in every setting.
These examples make a broad point about language technology: statistical fluency begins with repeated patterns, not a guarantee of grounded meaning. A small corpus makes this visible because the model can only remix a narrow set of contexts. The same principle applies to larger systems, though the patterns are harder to inspect. Contextual similarity is useful for search and organization, but downstream users should distinguish a model’s learned associations from claims about truth, intent, or equivalence.
Treat recommendations and network rankings as choices about whose similarity counts.
Connections can be measured several ways. Degree centrality counts a person’s direct links, while betweenness centrality rewards nodes that lie on many shortest paths. PageRank gives more weight to endorsements from highly ranked nodes, so Thor outranks users with more endorsements because his supporters direct their influence toward him.
Recommendations make similar choices. User-based filtering suggests interests liked by similar users; item-based filtering recommends interests that co-occur with a person’s current interests. Matrix factorization learns compact user and item representations to predict ratings. On MovieLens 100k, the book’s small embedding model lowers test mean squared error from roughly 1.26 for an average-rating baseline to about 0.89. These approaches rank options, but the scores reflect the chosen data and similarity rules.
Ranking systems transform social structure into apparent authority. PageRank’s recursive idea is powerful because an endorsement’s value depends on who gives it, yet this also makes the ranking sensitive to network boundaries and participation patterns. Recommendations have a related feedback risk: past choices shape what appears next, which can narrow future exposure. A useful system should be judged not only by prediction error, but also by whether its ranking supports the intended human goal.
Build reliable data pipelines before expecting algorithms to work at scale.
Data work begins upstream. Files, APIs, and scraped web pages require parsing, validation, and transformation before analysis. Use tools designed for formats such as CSV rather than splitting rows by hand, and treat web scraping as fragile because page structure can change. Relational databases organize records into tables that can be filtered, joined, grouped, and indexed; filtering before a join can reduce unnecessary work.
Scale by dividing the job. MapReduce turns each input into key-value pairs, groups values by key, and reduces each group to a result. In word counting, a mapper emits each word with a count of one, and a reducer sums the counts. Distributed machines can process separate documents, then combine partial results, reducing the need to move all raw data to one computer.
The book’s practical emphasis on ingestion and transformation counters the glamorous image of data science as model selection alone. Reliable computation depends on mundane interface decisions: formats, schemas, missing values, and the cost of moving data. MapReduce captures a durable systems principle, even when a particular platform falls out of fashion: parallel work is easiest when a large task can be divided into local transformations and well-defined aggregations.
Audit a data product for who it harms, not just how well it predicts.
Technical success is not ethical approval. A chatbot that repeats harmful user input or an image classifier that mislabels Black people can fail because designers did not anticipate abuse, training data were unrepresentative, or errors carried unequal consequences. A model can also be accurate overall while producing different error rates across groups. Whether that is unfair depends partly on the decision and on which error imposes the harm.
Consider the whole system. Data products can affect privacy, access, speech, and public decisions. A hiring or parole model raises questions beyond its score: what data trained it, whether those data reproduce biased processes, and whether affected people can challenge an outcome. User consent or legal permission does not by itself settle whether selling, sharing, or repurposing personal data is responsible.
Fairness is not a single metric that can be optimized independently of social context. The competing error rates in the book’s example illustrate why teams can agree on the numbers yet disagree about which disparity matters most. That disagreement calls for explicit governance: identify stakeholders, name the harms, document tradeoffs, and create routes for appeal. Technical audits are necessary, but values and institutional power determine which outcomes count as acceptable.
Keep the fundamentals, then let mature libraries handle scale.
Practice on questions that matter to you. Grus closes by urging readers to find a dataset connected to a real curiosity, then build a small analysis or product. His examples include classifying Hacker News stories, analyzing fire-truck connections, distinguishing patterns in clothing images, and mapping geotagged tweets. Each project starts with a question, requires data collection and labeling, and forces practical choices about features and methods.
Use the right tools for the job. From-scratch code is valuable for learning, but NumPy, pandas, and scikit-learn provide faster, more robust tools for numerical work, data manipulation, and machine learning. PyTorch or TensorFlow handle deep learning far better than lists pretending to be tensors. The aim is not to avoid libraries; it is to understand enough to use them critically.
Personal projects are effective because they connect technical practice to sustained attention. They also reveal that much of the work lies outside the model: finding usable data, defining a target, and deciding what counts as success. Mature libraries reduce implementation burden, but they cannot supply a meaningful question or repair a poor measurement strategy. Fundamentals and tooling therefore complement one another: one provides judgment, the other makes useful work feasible.
Analysis
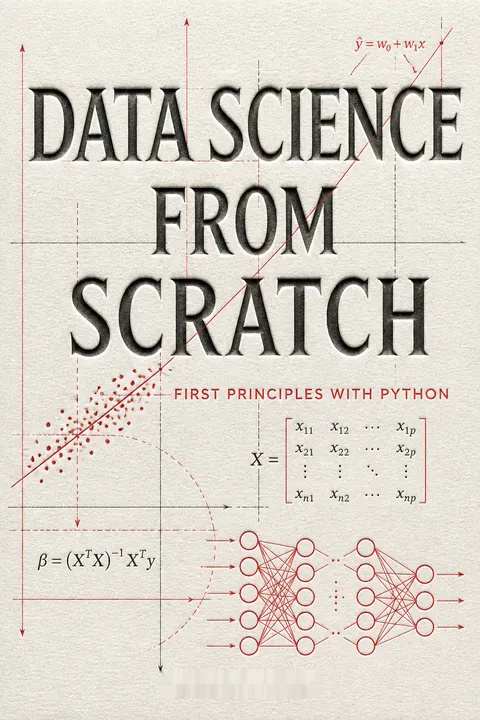
Data Science from Scratch is a technical primer organized as a sequence of problems at the fictional social network DataSciencester. Its central teaching device is construction: a question about users becomes a graph, a prediction task becomes a loss function, and a model becomes code whose mechanics can be inspected. That structure gives the book unusual coherence despite its wide coverage, from Python and probability to neural networks, databases, language, and ethics.
The most important claim is not that every practitioner should write production algorithms by hand. It is that understanding the machinery changes how a practitioner uses abstraction. Readers see why a median resists an outlier, why a test set must remain separate from model selection, why a high-accuracy classifier can be useless, and why recommendations encode a definition of similarity. Those are forms of judgment, not merely implementation skills.
The book’s breadth is both its advantage and its constraint. It offers a useful map of the field and enough miniature implementations to make core ideas tangible, but its simplified algorithms should not be mistaken for comprehensive statistical or engineering treatments. For example, toy data can make a model appear cleaner than it will be in deployment, and a conceptual demonstration cannot resolve every assumption behind inference or fairness. The author explicitly points readers toward mature libraries and deeper study, a crucial boundary around the promise of the title.
A modern reading also sees the book’s practical ethic emerging from its technical chapters. Data collection, missing values, validation, and feature choices are not peripheral chores; they determine what conclusions are possible. The ethics chapter extends that point: data products distribute consequences, not just predictions. The strongest use of this book is therefore as a foundation for asking disciplined questions. It teaches readers to move from an interesting problem to inspectable code, while reminding them that an algorithm’s output is only as meaningful as its data, assumptions, and intended use.
Review Summary
Data Science from Scratch receives mixed reviews. Many praise its practical approach and hands-on examples for beginners, appreciating the author's clear explanations and engaging writing style. The book's focus on building algorithms from scratch is seen as beneficial for understanding fundamentals. However, some critics find it too basic for experienced practitioners or lacking in-depth explanations. Readers appreciate the wide range of topics covered but note that the code examples may not be practical for real-world applications. Overall, it's recommended for those new to data science seeking a practical introduction.
People Also Read






Glossary
Gradient descent
Iterative parameter optimizationAn optimization method that repeatedly adjusts model parameters in the direction that reduces an objective function. The gradient indicates how the function changes as parameters move. Step size controls how far each update travels; updates based on a full dataset, a minibatch, or one example produce different versions of the method.
Simpson’s paradox
A reversed aggregate relationshipA statistical pattern in which an association observed across combined groups changes direction when the data are examined within relevant subgroups. The reversal can occur because group composition differs on a third variable. The book’s example shows an overall coast-to-coast friendship comparison reversing after educational attainment is considered.
Overfitting
Memorizing training quirksA model overfits when it captures details specific to its training data, including noise, and consequently performs poorly on new examples. Increasing model complexity can improve training performance while harming generalization. Separate training, validation, and test data help detect this problem and prevent model selection from contaminating final evaluation.
Naive Bayes
Probabilistic feature classifierA classification method that combines estimates of how likely features are within each class using Bayes’s theorem. Its simplifying assumption is that features are conditionally independent given the class. The assumption is often unrealistic, but the model can still work well, as in the book’s word-based spam filter.
Principal component analysis (PCA)
Variation-focused dimension reductionA method that represents data along new directions chosen to capture as much variation as possible. The first component captures the largest directional variance, and further components capture remaining variation. PCA can reduce dimensionality or combine correlated features, but transformed dimensions may be less interpretable than the original variables.
Random forests
Ensemble of randomized treesA collection of decision trees whose predictions are combined, commonly by voting for classification or averaging for regression. The trees are made different through techniques such as training on bootstrap samples and considering random subsets of candidate split features. Combining them can reduce the tendency of a single tree to overfit.
Latent Dirichlet allocation (LDA)
Probabilistic topic discoveryA topic-modeling method that represents documents as mixtures of topics and topics as distributions over words. It assumes that each document word is generated by first choosing a topic and then choosing a word associated with that topic. The resulting topics are probability patterns that people interpret by inspecting their most characteristic words.
PageRank
Link-weighted importance rankingA method for ranking nodes in a directed network by considering both incoming links and the importance of the nodes that provide them. Each node passes some of its score through outgoing links, while a damping component redistributes score across the network. It was developed for ranking web pages and can also rank endorsements.
MapReduce
Distributed key-value processingA programming model for processing large collections of data in parallel. A mapper emits key-value pairs from input records, values are grouped by key, and a reducer aggregates each group. Word counting is a basic example: emit each word with a count of one, then sum counts for each word.
Matrix factorization
Compact user-item representationsA recommendation approach that approximates a user-item ratings matrix as the product of lower-dimensional user and item representations. A predicted rating is calculated from the corresponding user and item vectors. The learned dimensions are latent patterns, which can improve predictions without necessarily having an obvious human interpretation.
FAQ
What's Data Science from Scratch by Joel Grus about?
- Focus on Fundamentals: The book emphasizes understanding data science concepts from the ground up, using Python. It covers essential topics like statistics, linear algebra, and machine learning.
- Hands-On Approach: Readers are encouraged to implement data science techniques themselves, fostering a deeper appreciation for the underlying principles.
- Real-World Applications: Practical examples and real datasets are used to illustrate concepts, making the material relatable and applicable to real-world problems.
Why should I read Data Science from Scratch by Joel Grus?
- Comprehensive Learning: Ideal for beginners, the book provides a solid foundation in data science without requiring prior knowledge.
- Python-Centric: It introduces Python programming alongside data science concepts, offering a dual learning experience.
- Updated Content: The second edition includes new material on deep learning, statistics, and natural language processing, reflecting the latest trends.
What are the key takeaways of Data Science from Scratch by Joel Grus?
- Understanding Data Science: Defines data science as the intersection of hacking skills, math and statistics knowledge, and substantive expertise.
- Building from Scratch: Emphasizes the importance of building algorithms from scratch to demystify complex concepts.
- Importance of Clean Code: Stresses writing clean, maintainable code, essential for effective data science work.
What is the Bias-Variance Tradeoff in Data Science from Scratch by Joel Grus?
- Model Complexity: Describes the balance between minimizing bias and variance, crucial for building effective models.
- Overfitting vs. Underfitting: Explains how high bias may lead to underfitting, while high variance may cause overfitting.
- Practical Implications: Suggests adding features to reduce bias and simplifying models to reduce variance.
How does Data Science from Scratch by Joel Grus define Data Science?
- Definition: Describes data science as "the sexiest job of the 21st century," emphasizing its growing importance.
- Core Skills: Highlights the intersection of hacking skills, math and statistics knowledge, and substantive expertise.
- Real-World Examples: Provides examples of data science applications, such as predicting customer behavior.
What is the Central Limit Theorem as explained in Data Science from Scratch by Joel Grus?
- Definition: States that the distribution of the sample mean approaches a normal distribution as the sample size increases.
- Implications for Data Science: Allows inferences about population parameters based on sample statistics.
- Practical Application: Illustrates the theorem with examples, showing its role in statistical methods like regression analysis.
What is Gradient Descent in Data Science from Scratch by Joel Grus?
- Optimization Technique: An algorithm used to minimize model error by iteratively adjusting parameters.
- Learning Rate: Requires a learning rate to determine step size towards the minimum, crucial for convergence.
- Applications: Used in various models, including linear regression and neural networks.
How does Data Science from Scratch by Joel Grus explain Naive Bayes?
- Spam Classification: Uses Naive Bayes as an example of a simple yet effective classification technique.
- Independence Assumption: Assumes feature independence given the class label, simplifying probability computation.
- Implementation: Provides a step-by-step guide to implementing a Naive Bayes classifier.
What is the significance of R-squared in Data Science from Scratch by Joel Grus?
- Goodness of Fit: Indicates how well independent variables explain the variability of the dependent variable.
- Limitations: Can be misleading, especially in models with many predictors, as it doesn't account for model complexity.
- Practical Use: Emphasizes using R-squared alongside other metrics for comprehensive model performance assessment.
What is the importance of linear regression in Data Science from Scratch by Joel Grus?
- Foundational Technique: A simple and widely used statistical technique, serving as a building block for complex models.
- Predictive Modeling: Used for predictive modeling, allowing informed decisions based on data.
- Implementation from Scratch: Provides a detailed explanation of implementing linear regression in Python.
How does Data Science from Scratch by Joel Grus approach data visualization?
- Importance of Visualization: Emphasizes that effective visualization is crucial for understanding and communicating insights.
- Matplotlib Library: Introduces Matplotlib for creating visualizations in Python, aiding in data presentation.
- Examples and Best Practices: Offers examples of good and bad visualizations, teaching clear and informative graphic creation.
How does Data Science from Scratch by Joel Grus address data ethics?
- Importance of Ethics: Discusses the ethical implications of data science, emphasizing responsibility in considering the impact of work.
- Real-World Examples: Provides examples of data misuse and ethical dilemmas, illustrating the importance of ethical considerations.
- Encouraging Thoughtful Discussion: Encourages readers to engage in discussions about data ethics and think critically about their work.
Download PDF
Download EPUB
.epub digital book format is ideal for reading ebooks on phones, tablets, and e-readers.








