

Key Takeaways
Read price patterns as crowd behavior, not as a transcript of the news.
Prices register reactions. Frost and Prechter argue that markets reflect the shared hopes and fears of investors, rather than simply rising or falling in response to news. The same event can produce different market reactions in different emotional climates. In their view, the pattern of prices is therefore more informative than a tidy explanation attached to a headline after the fact.
The pattern is context. The authors present the Wave Principle as a way to locate the market within a larger behavioral sequence and judge plausible next moves. Its central pattern has five waves moving with the trend, followed by a correction in three waves or a variation of that form. The method is meant to organize analysis, not to deliver certainty about each turn.
This view usefully separates an event from the market’s interpretation of it. In complex systems, outcomes can emerge from many interacting decisions, so a single headline rarely explains a broad movement on its own. Still, saying prices reflect collective psychology does not establish that psychology follows one stable pattern. Economic news can affect cash flows and risk as well as mood. The framework is strongest as a lens for asking how investors are positioned and reacting, not as a reason to dismiss material changes in business conditions.
Track the same five-forward, three-back structure across market time scales.
Patterns nest inside patterns. A five-wave advance contains smaller waves, and those smaller waves can themselves divide into five-wave advances and three-wave corrections. Once the advance ends, a correction of comparable degree follows. The authors describe this repeated structure as self-similar: the basic form appears across different sizes, from short-term price changes to long historical movements.
Degree means relative size. Elliott’s labels, from Subminuette to Grand Supercycle, mark a wave’s position within the larger structure, not a fixed number of days or points. A price movement may be difficult to classify at first; the surrounding waves often clarify its relative degree. The practical lesson is to compare neighboring and enclosing patterns, rather than treating every fluctuation as a separate signal.
Nested patterns offer a valuable way to connect short-term moves with long-term context. Similar scaling ideas appear in the study of fractals, where a shape can retain features across magnification. But resemblance across scales is not, by itself, proof of a common mechanism or a reliable forecast. Analysts can also find patterns more readily when they choose the scale and boundaries after the fact. The concept becomes most useful when wave labels are constrained by explicit rules and tested against price behavior that was not used to create the count.
Reject wave counts that break structural rules, however attractive the story.
Some counts are disallowed. In a standard impulse, the second wave cannot erase the first wave’s entire gain, the third wave cannot be the shortest of the three advancing waves, and the fourth wave does not overlap the first wave’s price territory. These are rules, not preferences. An ending diagonal is a defined exception to the usual no-overlap pattern, which is why pattern type matters before judging a count.
Corrections are not impulses. A correction is never a simple five-wave structure under the system. Common corrective forms include the zigzag, with a 5-3-5 subdivision, and the flat, with a 3-3-5 subdivision. The authors recommend eliminating counts that violate rules before choosing among plausible alternatives. This deductive approach is intended to prevent analysts from relabeling inconvenient price action just to preserve a preferred forecast.
The distinction between hard constraints and softer tendencies is a strength: it gives an analyst a way to say that a proposed interpretation is wrong, not merely unpopular. This resembles model checking, where a theory must satisfy structural requirements before it is considered. Yet rule-governed flexibility can still become subjective if exceptions multiply or the analyst keeps changing the count. The safeguard is a written record of labels, invalidation levels, and revisions, so that a persuasive explanation is not mistaken for an independently confirmed one.
Expect corrections to be messy, and use alternation to narrow possibilities.
Reactions vary more. Motive waves move with the larger trend and are usually easier to classify. Corrective waves move against it, and the authors describe them as more varied, overlapping, and difficult to interpret before they finish. A sideways correction may take the form of a flat or triangle; a sharp correction is often a zigzag. More than one corrective pattern can also combine into a longer structure.
Look for contrast. The guideline of alternation says that if an impulse’s second wave is sharp, its fourth wave is often sideways, and vice versa. It is a tendency, not a rule. The book also observes that corrections often end near the price territory of the previous fourth wave at a smaller degree. That area can help frame a target, but the examples include exceptions, so it cannot serve as a guaranteed floor or ceiling.
Alternation is valuable because it discourages the lazy assumption that the next phase will resemble the last. It is a probabilistic constraint, similar to using a prior expectation rather than a fixed prediction. The difficulty is that terms such as sharp and sideways require judgment, and a complex correction may support several valid readings. The method therefore rewards patience: when the evidence is ambiguous, keeping several counts alive is more rigorous than forcing a clean pattern onto noisy prices.
Use wave personality to distinguish strong trends from seductive countertrend rallies.
Different waves feel different. The authors connect wave structure to recurring shifts in investor mood. Third waves, which often extend, are described as broad, forceful advances with strong participation and volume. Fifth waves can continue upward while market breadth narrows, leaving optimism high even as fewer stocks lead. These tendencies can help an analyst judge a count when the chart alone is unclear.
Beware corrective enthusiasm. B waves, which rise within a larger correction, are portrayed as especially deceptive: they may look like the start of a new advance while lacking broad confirmation. By contrast, a declining C wave often has the persistence and force associated with a third wave. The examples include rallies that inspired optimism despite weak participation or disagreement between market averages. These are guidelines about typical behavior, not labels that can be assigned from sentiment alone.
The psychological reading adds texture to technical analysis. It asks whether participation, breadth, and sentiment fit the proposed structure, rather than treating a price chart as geometry alone. This is compatible with behavioral finance’s attention to changing risk appetite and crowd confidence, though the book’s wave-to-emotion mapping remains an interpretive hypothesis. A narrow advance can persist, and a broad rally can fail. Breadth and volume are best used as corroborating evidence, not as proof that a particular wave label is correct.
Let Fibonacci ratios set targets, but let price structure lead.
Ratios help estimate scale. The Fibonacci sequence begins 1, 1, 2, 3, 5, 8, with each number formed by adding the previous two. Ratios between later terms approach 0.618 and its reciprocal, 1.618. The authors use these proportions to compare wave lengths, retracements, and sometimes durations. For example, two non-extended advancing waves may be similar in size, or one may measure about 0.618 of the other.
Form comes first. The book cites analyst Hamilton Bolton’s 1960 projection that the Dow would reach about 1,000, based on a Fibonacci relationship. The market later peaked at 995.82 on an hourly reading. The authors present this as striking evidence, while warning that a ratio is only useful after the wave pattern is correctly identified. Their stated priority is to use ratios to support or challenge a count, not to manufacture one.
A ratio can turn a vague expectation into a testable price zone, which is analytically helpful. The danger is selective attention: with many waves, ratios, starting points, and chart scales available, some match is likely to appear by chance. This is a classic multiple-comparisons problem. Bolton’s close forecast is notable, but a persuasive evaluation would also record missed targets and compare the method with simple alternatives. Fibonacci proportions can sharpen a hypothesis; they do not independently validate the larger theory.
Trade probabilities with an alternate count, an invalidation point, and patience.
A count is not certainty. The preferred count is the interpretation that best satisfies the rules and guidelines. An alternate count records the next most plausible reading if prices contradict that view. The authors recommend updating both as the market moves, rather than treating the preferred scenario as a promise. When no interpretation is clearly superior, waiting is a legitimate decision.
Price must be allowed to disagree. Because a wave count depends on observable price patterns, a move beyond the level permitted by the proposed pattern shows that the analysis is wrong. That level can serve as a point to reconsider or limit exposure. The authors also distinguish analytical skill from the emotional difficulty of risking money, and advise setting aside only a limited amount for speculation. The method can guide decisions, but it cannot remove losses or guarantee profitable trading.
The alternate-count practice is a disciplined form of scenario planning. In decision science, preparing for a second plausible outcome can reduce the tendency to defend a favored forecast after contrary evidence arrives. An invalidation point also makes a claim more falsifiable. But a technical exit is not automatically a sound risk plan: gaps, execution costs, and position size matter. Wave analysis is most responsible when paired with controls that limit the damage of being wrong, rather than confidence in the elegance of the count.
Apply the pattern most confidently to broad averages, not every stock.
Averages capture shared behavior. The authors argue that market indexes reveal mass investor psychology more clearly than individual securities, whose prices are also shaped by company-specific events. They cite an estimate that roughly 75 percent of stocks rise with the market and 90 percent fall with it, while cautioning that individual stocks can produce less reliable wave counts. Their metaphor is that a single droplet behaves differently from the ocean wave carrying it.
Markets have distinct character. Commodities can show clear wave patterns, but their advances may be driven by fear of scarcity, inflation, or war. The book says fifth-wave extensions are more common in commodities than in stock averages. Gold is offered as an example of a market whose price behavior sometimes moved against stocks. The practical guidance is to analyze an individual security only when its pattern is unusually clear, rather than forcing every chart into the same template.
This distinction reflects an important statistical idea: aggregation can reveal common movement while reducing the influence of idiosyncratic noise. It also cautions against transferring a pattern from one asset class to another without adjustment. Still, an index is not a pure measure of collective psychology; its construction, membership, and concentration affect its behavior. The book’s percentage estimates are historical claims from its period, not timeless constants. Analysts should treat them as context, not as current market statistics.
Treat spectacular forecasts as evidence to test, not proof of a universal law.
The record is mixed. In 1978, Frost and Prechter argued that a major bull market remained ahead and projected a Dow target near 2,860, with a likely top around 1982 to 1984. The appendix and postscript report that the broad bullish call was followed by a powerful advance, but the timing was substantially wrong: the relevant wave continued far longer than expected, and the market exceeded the original price target. The authors also revised their interpretation as new price action arrived.
A forecast tests a theory. The book treats accurate long-range calls as evidence that wave analysis has value, while insisting that the live market must overrule a preconceived scenario. Its more ambitious claim is that recurring market forms express a natural law. That claim is much broader than the practical observation that patterns may help organize decisions. A forecast can be impressive without proving that every market follows one universal design.
The combination of a successful directional thesis and poor timing is a useful case study in forecast evaluation. A method should be judged by its full record, including changed counts, missed dates, and the risk incurred while waiting for a target. Out-of-sample testing, clear rules fixed in advance, and comparison against simple benchmarks would help separate predictive information from hindsight pattern-fitting. The book’s bold claims deserve serious testing, but its own forecast history argues for calibrated confidence rather than either dismissal or faith.
Analysis
The book’s lasting contribution is less a claim that markets obey a cosmic blueprint than a disciplined vocabulary for describing market structure. Its central move is to replace single-cause explanations with nested patterns of advance and correction, then use explicit constraints to reduce the number of plausible interpretations. The combination of pattern rules, market breadth, volume, sentiment, and price targets can encourage analysts to ask better questions than whether a headline sounds bullish.
Its method also contains a tension. The authors describe wave structure as objective and governed by rules, yet they acknowledge that corrective patterns are complex, wave degree is often uncertain, and guidelines allow exceptions. This makes the framework flexible enough to describe varied markets, but flexibility can also make retrospective fitting easier. A serious test must specify how counts are selected, when an interpretation is invalidated, and how successful forecasts compare with unsuccessful ones. It must also account for transaction costs and the difficulty of acting on a correct long-term view through years of noisy movement.
The book’s forecast history illustrates both sides. The broad call for a major advance was directionally powerful, while the original timing assumptions required revision and the market continued beyond the stated target. That is neither a trivial success nor a clean confirmation of a universal law. It is evidence that should be separated into components: direction, magnitude, timing, and practical investability.
The most transferable lesson is therefore methodological humility. Use the wave count to structure scenarios, use price action to challenge it, and preserve alternatives. Treat Fibonacci relationships and crowd psychology as supporting clues rather than independent guarantees. The framework is most persuasive when it narrows uncertainty without pretending to abolish it.
Review Summary
Elliott Wave Principle receives mixed reviews, with an average rating of 3.93/5. Readers appreciate its clear explanation of wave theory and market psychology, finding it useful for long-term forecasting. However, critics note a lack of empirical evidence and outdated examples. Some find it difficult to understand, while others consider it essential for technical analysis. The book is praised for its comprehensive coverage of Elliott Wave concepts but criticized for being overly theoretical and lacking practical application for short-term trading.
People Also Read








Glossary
Wave Principle
Recurring market structureThe book’s theory that market prices form recurring patterns of progress and correction. The basic structure has five waves moving with a larger trend and a corrective phase of three waves or a variation. These patterns are said to repeat at different relative sizes, reflecting collective investor behavior and helping analysts assess the market’s position and possible next moves.
Motive wave
Trend-direction wave patternA wave that moves in the same direction as the trend of the next larger degree and subdivides into five waves. The common impulse form follows specific rules, including limits on how far waves two and four can retrace and a prohibition on wave four overlapping wave one. A diagonal is a less common motive variation with different structural features.
Corrective wave
Countertrend patternA wave that moves against the trend of the next larger degree. It usually subdivides into three waves or a combination of corrective patterns, rather than a simple five-wave impulse. The book identifies zigzags, flats, triangles, and combinations as major forms. Corrections are considered harder to interpret because they can overlap, vary in complexity, and develop sideways.
Wave degree
Relative pattern sizeA wave’s position and scale relative to the smaller waves inside it and the larger waves around it. Elliott’s labels range from Subminuette to Grand Supercycle, but degree is not defined by a fixed number of points or days. Analysts infer it from the surrounding structure, and the exact degree may remain uncertain until later price action clarifies the pattern.
Extension
Elongated motive waveA motive subwave that becomes substantially longer and more subdivided than the other advancing waves in the same impulse. The book says most impulses have one extended wave, often the third in stock markets. Recognizing an extension can help estimate the relative size of the remaining waves, although the pattern may occasionally be difficult to distinguish while it is developing.
Alternation
Contrast between correctionsA guideline that similar corrective waves within a larger pattern tend to differ in form. In an impulse, for instance, a sharp second-wave correction is often followed by a sideways fourth-wave correction, or the reverse. Alternation helps analysts identify what to expect and what not to expect, but it is a tendency rather than a rule and does not determine the exact next pattern.
Wave personality
Typical sentiment by waveThe book’s term for the recurring emotional and market characteristics associated with different wave positions. Third waves are typically described as broad and forceful, while fifth waves may continue amid narrowing participation and strong optimism. Corrective B waves can appear deceptively bullish. These tendencies can support a wave interpretation, especially when price patterns permit more than one possible count.
Preferred count
Best-supported interpretationThe wave interpretation that currently fits the largest number of the system’s rules and guidelines. It represents the analyst’s leading scenario, not a certainty about what prices must do. The book recommends maintaining an alternate count as well, so that a violation of the preferred pattern can prompt a timely change of view rather than an attempt to defend a failed forecast.
Fibonacci ratio
Proportion between wave lengthsA proportion derived from relationships among Fibonacci sequence numbers. Ratios between later neighboring terms approach 0.618 and 1.618. In the book, these proportions are used to compare the lengths or retracements of market waves and to estimate possible targets. The authors treat ratio analysis as supporting evidence: the wave pattern must be identified first, and the ratio cannot guarantee a market turn.
FAQ
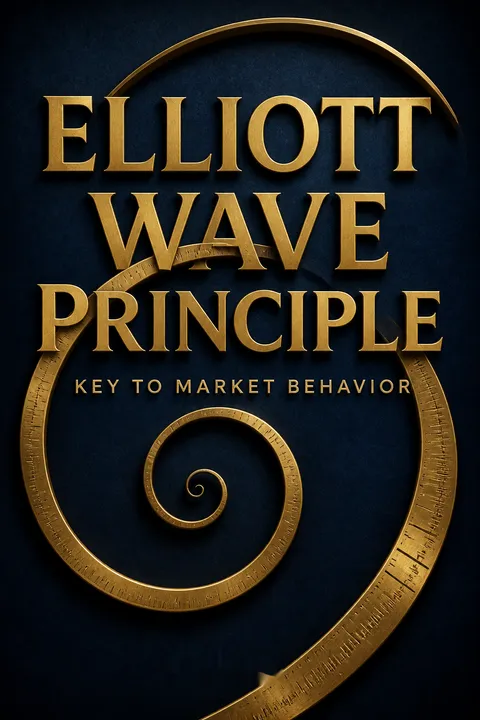
What's "Elliott Wave Principle: Key to Market Behavior" about?
- Overview: The book, authored by Robert R. Prechter Jr., explores the Elliott Wave Principle, a theory that suggests market prices move in predictable patterns based on investor psychology.
- Historical Context: It delves into the historical and mathematical background of the Wave Principle, linking it to natural phenomena and the Fibonacci sequence.
- Application: The book provides a comprehensive guide on applying the Wave Principle to forecast market trends and behaviors.
- Structure: It is divided into two parts: the theory behind the Elliott Waves and their practical application in market analysis.
Why should I read "Elliott Wave Principle: Key to Market Behavior"?
- Market Insight: It offers a unique perspective on market behavior, emphasizing the psychological patterns that drive market movements.
- Forecasting Tool: The book presents the Elliott Wave Principle as a powerful tool for predicting market trends, which can be valuable for investors and traders.
- Historical Success: The authors provide historical examples where the Elliott Wave Principle successfully predicted market movements, adding credibility to the method.
- Comprehensive Guide: It serves as both a theoretical and practical guide, making it suitable for both beginners and experienced market analysts.
What are the key takeaways of "Elliott Wave Principle: Key to Market Behavior"?
- Wave Patterns: Markets move in repetitive wave patterns that can be analyzed to predict future movements.
- Fibonacci Sequence: The Fibonacci sequence and ratios play a crucial role in the structure of these waves.
- Market Psychology: The book emphasizes the influence of mass psychology on market trends, suggesting that human behavior is predictable.
- Practical Application: It provides detailed guidelines on how to apply the Wave Principle in real-time market analysis.
How does the Elliott Wave Principle work according to Robert R. Prechter Jr.?
- Wave Structure: The principle is based on a five-wave pattern in the direction of the main trend, followed by a three-wave correction.
- Motive and Corrective Waves: Waves are categorized into motive waves, which move with the trend, and corrective waves, which move against it.
- Fibonacci Ratios: The lengths and durations of waves often exhibit Fibonacci relationships, aiding in forecasting.
- Market Cycles: The principle suggests that market cycles are fractal, meaning they repeat at different scales.
What is the historical and mathematical background of the Elliott Wave Principle?
- Fibonacci Sequence: The principle is deeply rooted in the Fibonacci sequence, which appears in various natural phenomena.
- Golden Ratio: The book discusses the Golden Ratio, a key element in the Wave Principle, which is prevalent in art, architecture, and nature.
- Historical Context: It traces the origins of the principle back to Ralph Nelson Elliott, who discovered these patterns in the 1930s.
- Mathematical Foundation: The book explains how these mathematical concepts underpin the predictable patterns observed in market behavior.
How can the Elliott Wave Principle be applied to market analysis?
- Wave Identification: Analysts can identify wave patterns in market charts to predict future price movements.
- Ratio Analysis: The book provides methods for using Fibonacci ratios to determine potential price targets and turning points.
- Guidelines and Rules: It outlines specific rules and guidelines for wave formation, helping analysts avoid common pitfalls.
- Practical Examples: The book includes real-world examples and case studies to illustrate the application of the principle.
What are the guidelines of wave formation in the Elliott Wave Principle?
- Alternation: If wave two is a sharp correction, wave four will usually be a sideways correction, and vice versa.
- Channeling: Waves often form within parallel trend channels, which can be used to predict future price movements.
- Wave Equality: In a five-wave sequence, when wave three is the longest, waves one and five tend to be equal in price length.
- Volume and Momentum: Volume and momentum indicators can confirm wave counts and signal potential reversals.
What role does the Fibonacci sequence play in the Elliott Wave Principle?
- Wave Relationships: The lengths and durations of waves often exhibit Fibonacci relationships, aiding in forecasting.
- Golden Ratio: The Golden Ratio, derived from the Fibonacci sequence, is a key element in determining wave proportions.
- Natural Phenomena: The book draws parallels between the Fibonacci sequence in nature and its application in market analysis.
- Predictive Power: Understanding these relationships can enhance the accuracy of market predictions based on the Wave Principle.
What are some common misconceptions about the Elliott Wave Principle?
- Randomness: Some believe market movements are random, but the book argues that they follow predictable patterns.
- Complexity: While the principle may seem complex, the book provides clear guidelines and examples to simplify its application.
- Subjectivity: Critics claim the principle is subjective, but the authors emphasize its objective rules and guidelines.
- Limited Scope: The principle is often thought to apply only to stocks, but it can be used for various financial markets.
How does "Elliott Wave Principle: Key to Market Behavior" address market psychology?
- Mass Psychology: The book emphasizes the role of mass psychology in driving market trends and patterns.
- Predictable Behavior: It suggests that human behavior is predictable and manifests in the repetitive wave patterns observed in markets.
- Investor Sentiment: Understanding investor sentiment is crucial for applying the Wave Principle effectively.
- Psychological Phases: The book outlines the psychological phases of market cycles, helping analysts anticipate changes in trend.
What are the best quotes from "Elliott Wave Principle: Key to Market Behavior" and what do they mean?
- "The market is a reflection of mass psychology." This quote highlights the book's central theme that market movements are driven by collective human behavior.
- "The Wave Principle is not primarily a forecasting tool; it is a detailed description of how markets behave." This emphasizes the principle's role in understanding market behavior rather than just predicting it.
- "Nature uses the Golden Ratio in its most intimate building blocks and in its most advanced patterns." This quote connects the mathematical foundation of the Wave Principle to natural phenomena.
- "The stock market is the most meticulously tabulated reflector of mass psychology in the world." It underscores the market's role as a barometer of collective human sentiment.
How does "Elliott Wave Principle: Key to Market Behavior" compare to other market analysis methods?
- Dow Theory: The book complements Dow Theory by providing a more detailed structure for market analysis.
- Technical Analysis: It enhances traditional technical analysis by offering a framework for understanding market patterns.
- Random Walk Theory: The book challenges the Random Walk Theory by presenting evidence of predictable market patterns.
- Economic Analysis: It argues that economic indicators often lag behind market movements, making the Wave Principle a more timely tool for analysis.
Download PDF
Download EPUB
.epub digital book format is ideal for reading ebooks on phones, tablets, and e-readers.








