

Key Takeaways
Use statistics to make real questions answerable, not to worship numbers.
Start with the question. Statistics turns large, messy collections of information into summaries, comparisons, and informed guesses. It can help evaluate a cancer risk, compare quarterbacks, or detect suspicious test answers. The author’s own route into the subject began with a lesson: calculus felt pointless when taught as formulas alone, while statistics made sense once it answered practical questions. Intuition, he argues, often makes the technical machinery easier to understand.
Respect the tool. A computer can produce sophisticated calculations quickly, but bad data or careless methods can make the result dangerously misleading. A study might find that workers taking breaks have higher cancer rates, while overlooking that many smoke during those breaks. Numbers help organize evidence; they do not replace judgment about what the evidence represents.
Statistics is most useful as disciplined interpretation, not as a ceremony of mathematical authority. This resembles a map: it reduces a complicated landscape to features relevant to a particular journey, but no map contains the whole terrain. The practical emphasis also helps explain why statistical literacy matters beyond research careers. Citizens encounter quantified claims in medicine, finance, and public policy. Still, intuition is a starting point, not a final test. People can feel that a result makes sense and remain wrong, which is precisely why transparent methods and careful checks matter.
Every summary metric hides something; choose the one that matches your question.
The center can deceive. The mean is an average, but a few extreme values can pull it far from what is typical. When Bill Gates joins ten bar patrons each earning $35,000, the group’s average income leaps, though nobody else gets richer. The median, the midpoint of the ordered observations, stays near the ordinary patron’s income. Neither statistic is always best: if unusually long survival after a treatment matters, the median may hide the patients who live much longer.
Define the comparison. A useful statistic depends on what is being measured, for whom, and in what units. U.S. manufacturing output grew while manufacturing employment fell, telling two different parts of the same story. Income averages can rise while typical wages stagnate. Percent changes also depend on their starting value, and nominal dollars across decades are not comparable without adjusting for inflation.
A metric is not merely a neutral description. Its choice determines which features become visible and which disappear. This connects to measurement theory: before asking whether a number is correct, one must ask whether it operationalizes the idea of interest. A nation’s prosperity, a school’s quality, or a player’s value has no single self-evident numerical definition. The strongest reporting often presents several measures together, rather than forcing complexity into one ranking. That approach is less catchy, but it makes selective storytelling harder.
A pattern can predict what happens without explaining what causes it.
Association is not mechanism. Correlation measures how strongly two variables move together. Netflix uses rating patterns to recommend films: customers with similar preferences tend to enjoy similar titles. That can make a good prediction without explaining why either customer likes a film. The same distinction matters in public claims. Students from wealthier families tend to score higher on the SAT, but buying extra televisions would not improve their scores. Family resources and parental education may influence both.
Look for other explanations. A third factor can produce an apparent connection between two things, or the direction of influence may run backward. People who exercise may weigh less, but people in poor health may also find exercise harder. Correlation is valuable for finding patterns worth investigating. On its own, however, it cannot establish that changing one variable will change the other.
Prediction and explanation are different achievements. A weather forecast can be useful without a complete account of atmospheric physics; a policy decision usually demands more, because intervention depends on what would change if a cause were altered. This distinction also guards against a common rhetorical slide: a study reports that two things are associated, while a headline quietly turns that association into causation. Strong causal claims need a credible design, a plausible mechanism, or converging evidence, not merely a striking relationship.
Calculate expected payoffs before buying warranties, betting, or choosing doors.
Weight outcomes by odds. Expected value combines each possible payoff with its probability. A lottery ticket can win, but the book’s example of a $1 Illinois ticket had an expected payout of about 56 cents. A favorable expected value does not guarantee a good result on one try; repeated outcomes tend to move toward the average the probabilities predict.
Use information correctly. On Let’s Make a Deal, contestants chose among three doors, then host Monty Hall opened a different door to reveal a goat. Because Monty knew where the prize was and deliberately showed a goat, switching raised the chance of winning from one-third to two-thirds. For everyday purchases, the same reasoning explains why extended warranties on inexpensive printers are usually poor bets. Insurance makes more sense for losses, such as a house fire, that a person cannot comfortably absorb.
Expected value is a useful antidote to vivid but unrepresentative outcomes. A lottery winner is memorable; the many losing tickets are not. Yet the framework is not a complete decision rule. It treats payoffs as if they were interchangeable, while people reasonably care more about avoiding ruin than maximizing an average return. The book’s distinction between insurance and warranties points toward this nuance: probabilities inform decisions, but the ability to withstand a loss and the consequences of risk matter too.
A precise probability is worthless when its assumptions miss the real risk.
Models inherit their limits. Before the 2008 financial crisis, Wall Street firms used Value at Risk models to estimate potential losses. A figure such as a 99% confidence limit sounded reassuring, but it still allowed losses beyond that limit, with little guidance about how large they could become. The models relied heavily on recent market history, a period too calm to capture the housing collapse and wider turmoil that followed.
Check the hidden assumptions. Probability calculations also fail when events are treated as independent even though they share a cause. Two aircraft engines might both be affected by a flock of birds; their failure risks cannot simply be multiplied as if unrelated. A model can be mathematically precise and practically unsound. Good risk analysis asks what the model leaves out, especially rare events that could cause catastrophic damage.
The crisis illustrates a general problem in decision science: a model can create confidence faster than it creates knowledge. Historical data are indispensable, but extrapolating from a short, unusually tranquil period can mistake the absence of disaster for evidence that disaster is impossible. Robust planning therefore needs more than a central forecast. It asks how decisions fare under extreme scenarios and under assumptions that turn out to be wrong. The challenge is that stress tests cannot enumerate every surprise, so humility must remain part of risk management.
Trust polls only when the sample resembles the people being described.
Representation beats raw size. A properly selected sample can reveal the views of a much larger population. But a giant sample does not repair a systematic bias. In 1936, Literary Digest surveyed 10 million people and predicted that Republican Alf Landon would defeat Franklin Roosevelt. Its respondents, including magazine subscribers and households with cars or telephones, were wealthier than the public and more likely to support Landon. Roosevelt won decisively.
Ask who was missed. Pollsters use random selection, repeated calls, and other methods to reach a sample that resembles the relevant population. A poll of likely voters must represent likely voters, not simply everyone nearby. Sample size affects the margin of sampling error, but only after the sample is credible. Question wording matters too: reported support for capital punishment fell sharply when respondents were offered life without parole as an alternative.
Sampling is a form of inference whose weakest point is often social rather than mathematical. Who owns a phone, answers a call, or trusts a survey can shape the results before any calculation begins. This makes polling methodology part of the substantive story, not fine print. At the same time, no sample perfectly mirrors a dynamic public. Poll results should be read as estimates tied to a time, question, and population, rather than as permanent facts about what people believe.
Treat statistical significance as evidence against chance, not proof of importance.
Test a specific claim. Researchers often begin with a null hypothesis, such as the claim that a new drug has no effect. A p-value measures how likely it would be to observe results at least as extreme as the study’s if that hypothesis were true. A small p-value can justify rejecting the null, but it does not show that the effect is large, useful, or causal.
Keep the scale in view. A study of 59 children with autism and 38 controls found a brain-volume difference with a reported p-value of .002. That is evidence against equal average brain volume in the populations studied, not an explanation of autism. Significance thresholds also involve tradeoffs: a relaxed threshold risks false positives, while a strict one can miss real effects. The practical size of a difference matters alongside its statistical significance.
A p-value is easy to overread because it compresses a conditional statement into a single number. It does not tell the probability that a hypothesis is true, nor does it measure the value of an intervention. This distinction matters in medicine, where a tiny benefit can be statistically detectable in a large sample yet clinically negligible. The book’s emphasis on false positives and false negatives adds a decision-theoretic point: the acceptable evidentiary threshold depends partly on the costs of each kind of error.
Regression can isolate associations, but it cannot manufacture a causal experiment.
Control for competing factors. Regression analysis estimates how an outcome relates to one or more explanatory variables while accounting for other measured variables. In the Whitehall studies, researchers examined British civil servants and found that low-control jobs were associated with greater heart-disease risk, even after accounting for factors such as smoking and blood pressure. The method helps separate overlapping patterns, but its conclusions remain dependent on the data and variables included.
Observational evidence can mislead. A large study once associated estrogen supplements with fewer heart attacks, and a plausible theory supported prescribing them. Controlled clinical trials later found increased risks, including heart disease and stroke. The contrast shows why statistical adjustment is not equivalent to randomly assigning treatment. Unmeasured differences between groups can still distort an estimate, even when the regression is carefully calculated.
Regression is powerful because social and medical questions rarely arrive as clean laboratory comparisons. It can adjust for measured differences and expose relationships that crude averages obscure. Its limit is equally important: controlling for variables on a spreadsheet does not guarantee that all confounding has vanished. Researchers need theory to decide which factors matter, and research designs that support causal interpretation. Replication and independent evidence are not bureaucratic extras; they are safeguards against a persuasive model built on incomplete observations.
Judge programs against a credible version of what would happen without them.
Find the counterfactual. Program evaluation asks what would have happened without an intervention. A randomized experiment creates treatment and comparison groups by assigning participants at random. When randomization is impossible, researchers can look for a natural experiment or compare groups near an arbitrary eligibility cutoff.
Clever comparisons matter. In Washington, D.C., researchers used terrorism alert days, when police presence increased for reasons unrelated to ordinary street crime. Crime was about 7% lower on high-alert days than on days without the extra precautions. To study selective colleges, researchers compared students accepted to elite schools who chose to attend with similarly qualified students who went elsewhere. The general earnings advantage was small, with an exception for students from low-income families. Neither example observes every possible outcome, but each offers a more credible comparison than a simple before-and-after claim.
The counterfactual is the invisible half of causal reasoning. A program may look successful because the world improved for everyone, or ineffective because conditions worsened while it softened the decline. Comparison groups help distinguish those possibilities. The method also clarifies why randomization is valuable: it aims to make the groups alike before treatment, rather than trying to repair every difference afterward. When randomization is unavailable, careful design can still improve inference, but conclusions should reflect the remaining uncertainty.
When a metric becomes a target, expect people to optimize the score.
Measurement changes behavior. Test scores can help track learning, but tying rewards and penalties to a single number can invite gaming. In Houston, administrators facing pressure to improve dropout rates could classify students who left school as transfers or other departures. A reported dropout rate of 1.5% was challenged by an investigation estimating a rate between 25% and 50%.
The incentives can harm. Public mortality rankings for cardiologists encouraged some doctors to avoid high-risk patients, who could worsen their statistics even if surgery might help them. Teacher ratings based on student test-score gains may provide useful evidence, but those scores are noisy and do not capture every educational outcome. Metrics work best as one piece of a broader evaluation, with attention to how people might change their behavior in response.
This is a measurement problem with a behavioral feedback loop: once a measure affects status or money, the measured system adapts. The result can be genuine improvement, strategic compliance, or both. That insight connects to organizational design, where incentives need to reward the underlying mission rather than its easiest proxy. The answer is not to abandon measurement. It is to use multiple indicators, audit for unintended effects, and preserve professional judgment where a single score would create perverse incentives.
Data can predict private facts, but prediction alone cannot justify using them.
Prediction can feel intrusive. Target analyzed shopping patterns to identify customers who might be pregnant. Its model combined purchases such as unscented lotion and vitamin supplements into a prediction score. In one account, the retailer sent pregnancy-related offers to a teenager before her father knew she was expecting. The example shows how ordinary transactions can reveal sensitive information without a person explicitly disclosing it.
Accuracy is not permission. Similar data analysis can help insurers estimate risk, businesses tailor offers, or police identify likely crime locations. But a prediction can be wrong, and even an accurate prediction may be used unfairly. The book ends by placing data-driven power alongside questions of privacy, liberty, and consent. Statistical calculations can estimate what is likely; they cannot decide by themselves what organizations ought to do with that knowledge.
Predictive systems shift privacy from secrecy toward inference. A person may share no explicit medical information and still become legible through patterns in routine behavior. That creates a governance challenge: conventional consent may not cover conclusions a company derives from data never collected for that purpose. Accuracy is also an incomplete ethical standard. Fairness, proportionality, and the opportunity to challenge a consequential decision matter, particularly when a model assigns risk to individuals who cannot see how it works.
Analysis
The book’s central contribution is not a collection of formulas, but a way to think about evidence. It repeatedly moves from a tempting claim to the choices hidden beneath it: what was measured, who was counted, which comparison was made, and what assumptions converted an observed pattern into a conclusion. Its anecdotes make technical ideas memorable because they show how statistical errors have consequences, from misleading polls and manipulated school scores to financial losses and medical harm.
The most useful organizing distinction is between description, prediction, and causation. A summary statistic describes; correlation can predict; causal inference requires a defensible comparison with a counterfactual. These functions overlap in practice, but confusing them is a reliable source of public misunderstanding. The book also shows that technical competence cannot settle every dispute. Choosing a measure, setting an error threshold, and deciding whether predictive profiling is acceptable all involve judgments about values and consequences.
A further implication is that statistical literacy should be institutional, not merely personal. Readers can question a poll or a headline, but organizations control the data, models, incentives, and access to appeals. Transparent methods help, yet transparency alone does not prevent biased samples, fragile assumptions, or harmful uses. The strongest culture of quantitative reasoning pairs numerical scrutiny with intellectual humility: claims remain revisable, uncertainty is stated plainly, and no single indicator is mistaken for reality itself. Statistics strips away some confusion, but it cannot relieve people of responsibility for what they conclude and do.
Review Summary
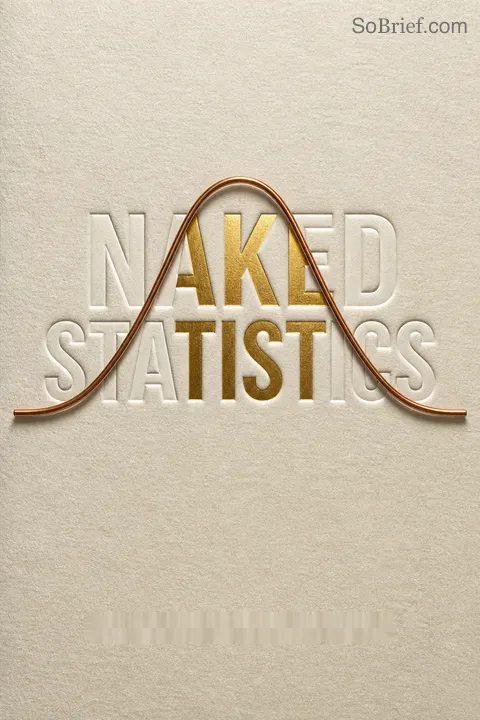
Naked Statistics receives mostly positive reviews for making statistics accessible and engaging through real-world examples and humor. Readers appreciate its clear explanations of complex concepts without heavy mathematics. Some find it too basic for those with prior statistics knowledge. The book is praised for cultivating critical thinking about statistical claims. Criticisms include occasional dry sections and overuse of American sports examples. Overall, it's recommended as an introductory text for students and general readers interested in understanding statistics.
People Also Read




Glossary
Central limit theorem
Sample means clusterA statistical result stating that the means of sufficiently large random samples tend to form a normal distribution around the population mean, even when the underlying population itself is not normally distributed. It helps researchers estimate how much a sample result is likely to differ from the population value.
Expected value
Probability-weighted average payoffThe average payoff anticipated across repeated outcomes, calculated by multiplying each possible outcome by its probability and summing the results. It supports comparisons among uncertain choices, such as a lottery ticket or investment, but does not predict what any single attempt will produce.
Value at Risk
Estimated loss thresholdA financial risk measure that estimates a loss limit over a stated period at a stated probability level. For example, a 99% estimate says losses should remain below the stated amount in 99% of cases under the model. It does not describe how severe losses might be in the remaining cases.
Null hypothesis
Starting claim under testThe initial claim used in statistical hypothesis testing, often that an observed treatment has no effect or that two groups do not differ. Researchers evaluate whether the observed data would be unusual if the null hypothesis were true. Evidence may justify rejecting it, but failure to reject does not prove it true.
p-value
Probability under the nullThe probability of observing results at least as extreme as those found in a study, assuming the null hypothesis is true. A small p-value can count as evidence against that hypothesis. It does not state the probability that the hypothesis is true, establish causation, or measure whether an effect matters in practice.
Regression analysis
Estimates adjusted relationshipsA method for estimating how an outcome varies with one or more explanatory variables. Multiple regression estimates the association with each included variable while accounting for others in the model. It can help separate overlapping patterns, but omitted factors, poor data, or reverse causality can still make the results misleading.
Selection bias
Unrepresentative inclusion in dataA distortion that arises when the people or observations included in a sample differ systematically from the population a study aims to describe. A very large sample can still be biased if some groups are more likely to be selected, reachable, or willing to participate.
Natural experiment
Unplanned comparison opportunityA situation in which an external event or rule creates groups that resemble treatment and comparison groups, even though researchers did not assign participants randomly. The resulting comparison can help estimate an intervention’s effect, provided the event affects outcomes through the treatment rather than other relevant pathways.
Counterfactual
Outcome without treatmentThe outcome that would have occurred for a person, group, or place if it had not received a particular treatment or intervention. Since the same subject cannot usually be observed both with and without treatment at once, program evaluation uses comparison groups or research designs to approximate this missing alternative.
Difference in differences
Compares changes across groupsA program-evaluation method that compares how an outcome changes over time in a treated group with how it changes over the same period in a similar untreated group. The comparison helps account for broader trends shared by both groups, assuming their trajectories would otherwise have been similar.
FAQ
What's Naked Statistics about?
- Demystifying Statistics: Naked Statistics by Charles Wheelan aims to simplify statistics, making it accessible to a general audience. It focuses on understanding concepts rather than memorizing formulas.
- Real-World Applications: The book uses relatable examples, such as sports statistics and polling data, to show how statistics explain everyday phenomena and their relevance in fields like economics and health.
- Empowering Readers: Wheelan encourages readers to critically analyze data, empowering them to understand and interpret statistical information confidently.
Why should I read Naked Statistics?
- Engaging Writing Style: Wheelan's humorous and engaging narrative makes learning about statistics enjoyable, with personal anecdotes and relatable examples.
- Practical Knowledge: The book equips readers with tools to interpret data critically, which is crucial in a data-driven world for making informed decisions.
- Accessible to All: Designed for readers with little to no background in math, Naked Statistics breaks down complex concepts into digestible pieces.
What are the key takeaways of Naked Statistics?
- Statistics Are Everywhere: Statistics play a crucial role in various aspects of life, from sports to politics, helping navigate the world more effectively.
- Correlation vs. Causation: Understanding the difference between correlation and causation is essential, as correlation does not imply causation.
- Central Limit Theorem: This foundational concept allows for powerful inferences about populations based on sample data, crucial for statistical analysis.
What is the Central Limit Theorem in Naked Statistics?
- Definition: The theorem states that the means of large samples from a population will be normally distributed around the population mean.
- Importance in Statistics: It underpins many statistical methods, including hypothesis testing and confidence intervals, allowing sample data to reflect population characteristics.
- Practical Application: Researchers can draw conclusions from limited data, as sample means cluster around the true population mean.
How does Naked Statistics explain correlation?
- Understanding Correlation: Correlation measures the degree to which two variables are related, with positive correlation indicating both increase together and negative indicating the opposite.
- Correlation Coefficient: Ranges from -1 to 1, with values closer to 1 or -1 indicating a stronger relationship, and 0 suggesting no correlation.
- Causation Misconceptions: Emphasizes that correlation does not imply causation, a common misconception in statistical analysis.
What are some common statistical errors discussed in Naked Statistics?
- Misleading Statistics: Statistics can be manipulated to mislead, highlighting the importance of critical thinking when interpreting claims.
- Overconfidence in Models: Warns against overconfidence in statistical models, which can create a false sense of security, as seen in the 2008 financial crisis.
- Ignoring Context: Errors often arise from failing to consider data context, making understanding background and methodology essential.
What is the Monty Hall Problem in Naked Statistics?
- Game Show Scenario: Based on Let’s Make a Deal, contestants choose one of three doors, with a car behind one and goats behind the others.
- Switching Doors: After a goat is revealed, switching doors increases the chance of winning the car from 1/3 to 2/3.
- Intuitive Explanation: Illustrates how intuition can lead to incorrect conclusions about probability, clarifying why switching is better.
How does Naked Statistics address the importance of data?
- Garbage In, Garbage Out: Emphasizes that data quality is crucial for accurate analysis, as poor data leads to misleading conclusions.
- Representative Samples: Discusses the importance of using representative samples for valid inferences about larger populations.
- Data Collection Challenges: Acknowledges challenges like selection bias, essential for accurate interpretation of statistical results.
What is the significance of descriptive statistics in Naked Statistics?
- Summarizing Data: Descriptive statistics simplify complex data sets into meaningful insights, making trends and patterns easier to understand.
- Measures of Central Tendency: Explains mean, median, and mode, which describe the center of a data distribution, each with strengths and weaknesses.
- Understanding Variability: Includes measures like standard deviation, indicating data spread, crucial for understanding reliability and significance.
How does Naked Statistics explain the concept of probability?
- Definition of Probability: Studies uncertainty and likelihood of outcomes, helping quantify risks and make informed decisions.
- Independent and Dependent Events: Distinguishes between events where outcomes are unrelated and those where they are related, vital for calculations.
- Real-World Applications: Illustrates probability use in fields like finance and healthcare, assessing risks and making predictions.
How does Naked Statistics explain statistical inference?
- Understanding Inference: Uses sample data to make conclusions about a population, illustrated through examples like drug effectiveness trials.
- Hypothesis Testing: Introduces hypothesis testing, starting with a null hypothesis and using data to decide whether to reject it.
- Confidence Levels: Explains confidence levels, typically set at 95%, indicating the reliability of study results.
What are the best quotes from Naked Statistics and what do they mean?
- “It’s easy to lie with statistics, but it’s hard to tell the truth without them.”: Highlights statistics' power in shaping narratives and the importance of responsible use.
- “Statistics can help us process data, which is really just a fancy name for information.”: Emphasizes statistics' role in making sense of vast data, essential for informed decision-making.
- “The paradox of statistics is that they are everywhere—but the discipline itself has a reputation for being uninteresting and inaccessible.”: Points out the irony of statistics' integral role yet perceived dullness, motivating efforts to make it engaging.

Download PDF
Download EPUB
.epub digital book format is ideal for reading ebooks on phones, tablets, and e-readers.








