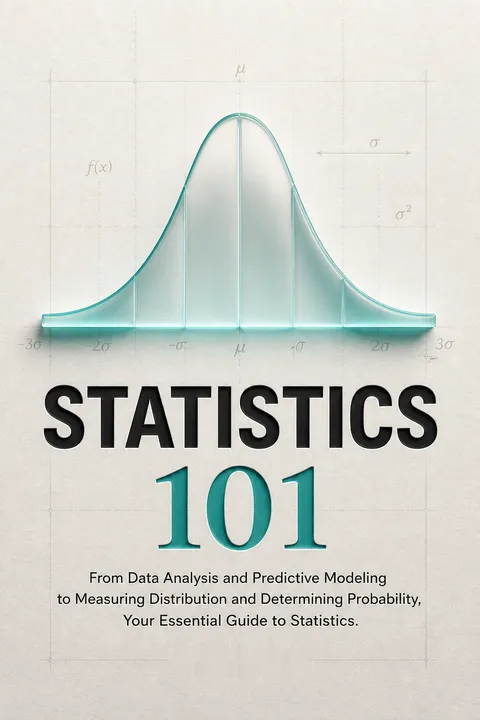


Key Takeaways
Treat statistics as a chain from a sharp question to a cautious forecast
Begin with a question. Statistics turns observations into descriptions, comparisons, and estimates. A study might ask which kinds of car maintenance improve fuel efficiency, then collect measurements on tire pressure, oil changes, and miles per gallon. Descriptive statistics summarize what was observed, using measures such as averages and graphs. Inferential statistics use a sample to estimate what may be true of a broader population.
Forecasts inherit their limits. A predictive model uses patterns in past data to estimate outcomes under similar conditions. The book points to baseball analytics, or sabermetrics, as one application: a small-budget team can use performance measures to make better player decisions. But a model is not a crystal ball. Its usefulness depends on the question, the data, and whether future conditions resemble those represented in the data.
The sequence is a useful antidote to the idea that statistical competence means knowing which button to press in software. It places judgment where it belongs: in defining the question, choosing measurements, and deciding what a result can support. This resembles the logic of scientific inquiry, where operational definitions determine what can be observed at all. One caution is that a forecast can be numerically precise while answering the wrong question. The most important quality check is therefore not just whether the calculation runs, but whether the measured variables genuinely represent the decision at hand.
A representative sample beats a million biased responses
Selection shapes conclusions. A population is the full group a study concerns; a sample is the portion actually measured. Random sampling gives members of that population a chance of inclusion, while stratified sampling ensures important groups are represented. A large sample reduces some kinds of random error, but cannot repair a systematic selection bias.
History makes the point. In 1936, The Literary Digest mailed questionnaires to 10 million people and received 2.1 million responses. Its poll predicted Alf Landon would defeat Franklin Roosevelt. The sample leaned toward people who had telephones, cars, and magazine subscriptions, groups with greater means and a different voting profile than the country as a whole. The impressive response count could not compensate for that skew. Polls also need to disclose uncertainty, including how respondents were selected and who did not respond.
The Literary Digest failure remains a compact lesson in the difference between precision and representativeness. A survey can estimate its respondents' views with remarkable consistency and still miss the population it claims to describe. Modern survey research faces the same issue when participation depends on internet access, interest, or trust in institutions. Random selection helps, but nonresponse can reintroduce bias if the people who answer differ systematically from those who do not. Sample quality is thus a property of the recruitment process, not a reward automatically earned by collecting more answers.
Plot the distribution before trusting its average
Shape carries information. A frequency distribution counts how often values or categories occur. Graphs make that pattern easier to see: bar charts compare distinct categories, histograms show how numerical values cluster across intervals, and time-series graphs reveal change over time. A scatterplot can show whether two measurements move together. The display should fit the data, not merely look attractive.
Check what the chart hides. A histogram can reveal a lopsided distribution, a cluster of unusual values, or two separate peaks that a single average would conceal. The book's manufacturing example also warns that changing the vertical scale can make similar performance look dramatically different. A graph is an argument about what matters, shaped by its intervals, axes, and categories. Inspect those choices before accepting the visual impression or comparing one chart with another.
Visualization is not decoration added after analysis; it is an early diagnostic. A distribution with two clusters may indicate different underlying groups, while a trend over time can expose change that a pooled average erases. This connects to exploratory data analysis, which treats plots as tools for finding errors and forming better questions, not as proof by themselves. The caution about scale is especially valuable because readers often interpret visual area or slope instinctively. Good practice includes labeling axes, showing relevant ranges, and explaining choices that could alter the story.
Report the median when a few extremes distort the mean
Averages tell different stories. The mean adds every value and divides by the number of observations. The median is the middle value after sorting; the mode is the most frequent value. Each describes a different aspect of a dataset, so calling all of them simply “the average” can mislead.
NBA pay illustrates the problem. In the book's 2017 example, the rounded salaries of 434 players have a mean of $7.1 million, a median of $3.4 million, and a mode of $1 million. One exceptionally large contract can pull the mean upward while barely moving the median. The median is often a better single summary for skewed data, but it does not tell the whole story either. A salary distribution, its spread, and the question being asked matter alongside the center.
The salary example shows why a statistic can be correct and still create a misleading impression. The mean answers a precise question about total value divided across people; the median answers what the middle person receives. Neither is inherently dishonest, but a headline that omits the choice can quietly steer interpretation. This is a general lesson in measurement: summaries encode a purpose. Reporting multiple measures is particularly useful when a distribution is skewed, though readers should also ask who or what is excluded from the dataset.
Measure spread, because equal averages can conceal unequal risk
Center is only half the picture. The range is the maximum minus the minimum, but one extreme observation can make it misleading. The interquartile range, or IQR, measures the span of the middle half of ordered values and is less affected by extremes. Variance and standard deviation summarize spread around the mean; standard deviation expresses that spread in the original measurement units.
Similar returns can feel different. The book compares two investments that each average a 10 percent annual return. One fluctuates daily between minus 5 and plus 5 percent; the other between minus 2 and plus 2 percent. The second has less variation and may be less risky for an investor who cannot tolerate sharp swings. Still, standard deviation does not remove outliers. It can itself be affected by extreme values, so robust measures and plots may be useful alongside it.
Risk depends on both the variability being measured and the consequences of different outcomes. Standard deviation is a convenient common scale, but it treats unusually large deviations as especially influential because they are squared in its calculation. That makes it informative for some applications and vulnerable to heavy-tailed data in others. A medical decision, an investment choice, and a manufacturing tolerance may require different definitions of harmful variation. The key question is not simply how wide the data spread, but which deviations matter and who bears their cost.
Use probability as a long-run rate, not a promise about tomorrow
Chance describes repeatable patterns. Empirical probability estimates how often an event occurs across observations. If a fair coin is tossed repeatedly, the proportion of heads tends to approach one-half over many trials, although any short run can look lopsided. Independent events do not change one another's probabilities; drawing a card without replacing it, by contrast, changes the odds on the next draw.
Small runs invite overconfidence. The book gives a true-or-false test with 20 questions, each guessed at random. The chance of getting at least 13 correct is about 13 percent, not zero. A rare outcome can happen, and a few observations are weak evidence about the underlying rate. Large samples often stabilize estimates, but there is no universal rule that 100 observations guarantees a sound study. Required sample size depends on the desired precision, variation, and sampling design.
The distinction between probability and certainty is central to sound decisions. People often mistake a low-probability event for an impossible one, or read a short streak as evidence that the odds have changed. The book's gambling examples make that intuition visible, while the large-sample principle explains why repeated observations help estimate stable rates. Yet increasing the number of trials only reduces random noise. If the coin is biased, the questions are leading, or the sample is selected poorly, repetition can make a flawed estimate more confidently wrong.
Normal curves simplify decisions, but crisis lives in the tails
A useful approximation. A normal distribution is a symmetric, bell-shaped pattern in which mean, median, and mode coincide. For data that closely follows this pattern, about 68 percent of observations fall within one standard deviation of the mean, about 95 percent within two, and about 99.7 percent within three. The central limit theorem explains why averages from sufficiently large random samples often look approximately normal, even when individual observations do not.
Rare does not mean harmless. Financial models built around historical market patterns can underestimate extreme events. The book uses the 2007-2008 crisis to show how movements treated as unusual became widespread as housing and financial markets broke down. A black swan event is an exceptionally disruptive event that ordinary expectations fail to anticipate. Normal models can be useful, but only when their assumptions fit the situation.
The normal curve is powerful partly because it compresses complexity into an interpretable scale. The danger is treating its elegant symmetry as a law of nature. The central limit theorem concerns distributions of sample averages under appropriate conditions; it does not make every collection of observations bell-shaped. Financial returns, disasters, and other extreme outcomes may have heavier tails than a normal model allows. Stress testing should therefore ask what happens outside the usual range, rather than assuming that a low modeled probability makes an outcome negligible.
Report uncertainty, and treat a failed null test as inconclusive
An estimate needs a margin. A confidence interval gives a range of plausible values for a population quantity, based on a sample and a stated method. In the book's campus example, 77 of 100 surveyed freshmen were satisfied with their majors; the estimated 90 percent interval for the larger group ran from 70 to 84 percent. A narrow interval offers greater precision, often requiring a larger sample. It does not erase selection bias or poor questions.
Tests do not certify truth. A null hypothesis is a baseline claim tested against an alternative. If the evidence is insufficient, the proper conclusion is to fail to reject the null, not to prove it true. A p-value measures how likely data at least as extreme would be if the null model held; it is not the probability that the null is true. The acceptable error level should reflect the consequences of being wrong.
Uncertainty is not a defect to hide; it is part of the result. A confidence interval is often misunderstood as assigning a 95 percent probability to a particular fixed interval after the data are observed. More precisely, the method produces intervals that capture the true parameter in 95 percent of repeated samples under its assumptions. Likewise, a small p-value does not measure practical importance. Readers need the effect size, study design, interval, and decision context to judge whether a finding matters beyond its statistical label.
Regression finds patterns; only a stronger design can support cause
Association is not intervention. Regression estimates how an outcome varies with one or more measured factors. In the book's restaurant example, sandwich weight and calories were strongly associated across 25 menu items, with a reported correlation of 0.903. The fitted equation can estimate calories for a sandwich whose weight falls within the observed range, roughly 126 to 445 grams. Using it for a 610-gram sandwich would be extrapolation beyond the data.
Prediction is not proof of cause. A regression can identify relationships useful for forecasting, but an association alone does not show that one factor caused another. Confounding variables may influence both. A study of snowfall and transit use, for example, might reveal a pattern, but other conditions could also affect ridership. Experiments or well-justified causal designs are needed before interpreting an estimated relationship as cause and effect.
Regression is valuable because it turns a cloud of observations into a quantified relationship, but the word “effect” can overstate what observational data establish. Causal inference requires a credible comparison: what would have happened to the same units under a different exposure? Randomized experiments can help answer that question, while observational studies need explicit assumptions and strategies for confounding. Prediction has a different standard. A model may forecast well without explaining causes, but its accuracy should be tested on data not used to fit it.
Audit the questions, exclusions, and incentives behind every result
Methods carry values. Survey wording, respondent recruitment, data sources, and decisions about unusual observations can all tilt a result. Short, objective questionnaires are more likely to be completed, while leading questions can shape answers. The book advises documenting collection procedures and qualifying questions so readers can assess possible bias. Removing outliers or smoothing data may be justified, but doing so without a clear rule can erase inconvenient evidence.
More data is not automatically better. Big data can reveal patterns across enormous populations, but it also raises questions about privacy, consent, and who benefits from collected information. The book's example of crime falling while computer use rose shows why a simultaneous trend does not establish a causal link. Transparent methods, repeatable procedures, and honest limits matter as much as computational power.
The ethical challenge is not limited to deliberate fraud. Researchers can produce biased conclusions through ordinary choices about which records count, how questions are framed, or when an analysis stops. Transparency makes those choices inspectable and gives other analysts a chance to test whether findings survive reasonable alternatives. Big datasets intensify rather than eliminate this responsibility: scale can magnify errors and make surveillance easier. A credible statistical report should therefore disclose not only its result, but also the path by which the data became that result.
Analysis
Statistics 101 presents statistics less as a collection of formulas than as a practical route from question to evidence. Its strongest through-line is that numerical sophistication cannot rescue weak measurement: the Literary Digest poll, the salary example, and the discussion of prediction all show how sampling, summaries, and interpretation shape what a result means. The book is accessible because it repeatedly connects abstract vocabulary to familiar settings such as elections, sports, manufacturing, and college surveys.
Its breadth is also its main limitation. The rapid tour from averages to regression, hypothesis tests, and big data sometimes makes rules of thumb sound universal. A sample of 100 is not automatically adequate; sample size must be tied to desired precision, population variability, and design. Nor does a bell-shaped graph certify good data. Many useful distributions are not normal, and data can be patterned without being bell-shaped. The book's explanations of confidence intervals and p-values also need careful reading: neither directly states the probability that a hypothesis or a specific interval is true. Standard deviation measures spread and does not remove outliers.
These corrections strengthen rather than undermine the book's central lesson. Statistical software can calculate a result, but it cannot decide whether a sample represents its population, whether an association is causal, or whether a model is safe to use outside its observed range. Those are questions of design and judgment. A modern reader should treat every number as the endpoint of a chain of choices, then inspect that chain: what was measured, who was missing, which assumptions were made, and what decisions the estimate can reasonably support. The book is most valuable as an invitation to ask those questions before trusting a confident-looking statistic.
Review Summary
Statistics 101 receives mixed reviews, with an average rating of 2.88 out of 5. Many readers criticize the book for containing errors, typos, and confusing explanations. Some find it shallow and not suitable for beginners. However, a few reviewers appreciate its concise overview and accessible language. Critics note issues with mathematical calculations and disconnected paragraphs. While some readers found it helpful as a quick refresher, others suggest seeking better alternatives for learning statistics. Overall, the book's reception is largely negative due to its perceived lack of depth and accuracy.
People Also Read







Glossary
Population
the full group of interestThe complete group of people, objects, events, or measurements a study aims to understand. Because observing every member is often impractical, researchers usually collect data from a sample and use it to estimate features of the population. Conclusions are only as relevant as the match between the sampled group and the population being discussed.
Sample
a measured part of a populationThe subset of a population from which a study actually collects observations. A sample can support estimates about the larger group when it is selected appropriately and is sufficiently informative for the question. A large sample does not guarantee representativeness: systematic selection bias can persist even when thousands or millions of observations are collected.
Descriptive statistics
summaries of observed dataMethods for organizing and summarizing the data that have been collected. They include measures of center, such as the mean and median, measures of spread, such as standard deviation and interquartile range, and visual displays such as histograms. Descriptive statistics describe the observed dataset; they do not by themselves establish what is true of a wider population.
Inferential statistics
estimates beyond observed dataMethods that use sample data to estimate population characteristics, test claims, or predict outcomes. Because a sample is not the entire population, inferential results include uncertainty and depend on assumptions about sampling and measurement. An inference is not a guaranteed conclusion; it is a reasoned estimate whose strength depends on study quality and analytical choices.
Interquartile range
spread of the middle halfThe difference between the third quartile and the first quartile in ordered data. These quartiles mark the boundaries of the middle 50 percent of observations. Because the IQR focuses on the center of the distribution rather than its minimum and maximum, it is less sensitive than the range to a small number of extreme values.
Central limit theorem
sample means tend toward normalityA statistical result stating that, under appropriate conditions, the distribution of sample means becomes approximately normal as sample size grows, even when the original population is not normally distributed. The theorem concerns the behavior of averages across repeated samples, not the shape of every individual dataset. How large a sample must be depends partly on the population's shape and variability.
Confidence interval
an uncertainty range for an estimateAn interval calculated from sample data using a method designed to capture a population parameter at a specified rate over repeated sampling. A 95 percent confidence procedure produces intervals that contain the true parameter in about 95 percent of repeated samples, assuming the method's conditions hold. It does not mean that a particular observed interval has a 95 percent probability of containing the fixed parameter.
Null hypothesis
the baseline claim under testA specified claim used as the starting point in a statistical test, often stating that there is no difference, relationship, or change. Researchers assess whether the sample evidence is sufficiently inconsistent with this claim to reject it in favor of an alternative. If evidence is insufficient, the standard conclusion is to fail to reject the null, not to prove it true.
P-value
data extremeness under a null modelThe probability, assuming the null hypothesis and the test's other assumptions are true, of observing data at least as extreme as the data collected. A small p-value indicates that the observed result would be unusual under that model. It is not the probability that the null hypothesis is true, nor does it measure the practical importance of a result.
Regression
a model of measured relationshipsA family of methods for estimating how an outcome varies in relation to one or more explanatory variables. Regression can describe associations and generate predictions within the scope of its data and assumptions. An estimated relationship does not by itself establish causation; confounding, biased sampling, model misspecification, and extrapolation can all undermine its interpretation or predictive use.
Black swan event
an extreme, disruptive surpriseA metaphor for an exceptionally rare and consequential event that standard expectations fail to anticipate, often followed by explanations that make it seem predictable in hindsight. The book applies the term to financial shocks that fall far outside the patterns on which ordinary models were based. The concept highlights the limits of forecasting from historical averages and assumed distributions.
FAQ
1. What is "Statistics 101: From Data Analysis and Predictive Modeling to Measuring Distribution and Determining Probability" by David Borman about?
- Comprehensive introduction to statistics: The book provides a beginner-friendly yet thorough overview of statistics, covering everything from basic concepts to more advanced topics like hypothesis testing and regression analysis.
- Practical applications: Borman explains how statistics are used in real-world scenarios such as business, finance, medicine, politics, and academic research.
- Step-by-step learning: The content is organized to build knowledge gradually, allowing readers to either study cover-to-cover or jump to specific sections as needed.
- Focus on understanding and application: The book emphasizes not just the math, but also how to interpret statistical results and apply them to solve problems or make predictions.
2. Why should I read "Statistics 101" by David Borman?
- Accessible for beginners: The book is designed for those new to statistics, making complex ideas understandable without requiring advanced math skills.
- Useful for students and professionals: Whether you’re taking a statistics course, need to brush up for work, or want to analyze data in daily life, the book offers practical guidance.
- Real-world relevance: Borman connects statistical concepts to everyday decisions, research projects, and current events, showing the value of statistical thinking.
- Self-contained learning resource: Each section stands alone, so you can focus on the topics most relevant to your needs.
3. What are the key takeaways from "Statistics 101" by David Borman?
- Statistics is about data: At its core, statistics involves collecting, analyzing, and interpreting data to answer questions or make predictions.
- Descriptive vs. inferential statistics: The book distinguishes between describing data (descriptive) and making predictions or inferences about populations (inferential).
- Importance of data quality and randomness: Reliable results depend on good data collection methods, random sampling, and awareness of potential biases.
- Statistical tools for decision-making: Concepts like mean, median, mode, standard deviation, probability distributions, and hypothesis testing are essential for analyzing and interpreting data.
4. What are the most important statistical concepts explained in "Statistics 101" by David Borman?
- Measures of center and spread: The book covers mean, median, mode, range, interquartile range, variance, and standard deviation, explaining how they describe data sets.
- Probability and distributions: Key ideas include empirical and subjective probability, binomial and normal distributions, and the law of large numbers.
- Sampling and data collection: Borman explains sampling methods (random, stratified, cluster, convenience), the importance of sample size, and how to avoid bias.
- Hypothesis testing and confidence intervals: The book details how to formulate hypotheses, calculate confidence intervals, and interpret p-values and significance levels.
5. How does David Borman define and differentiate descriptive and inferential statistics in "Statistics 101"?
- Descriptive statistics: These summarize and describe the main features of a data set, such as calculating averages, ranges, and visualizing data with charts and graphs.
- Inferential statistics: These involve making predictions or generalizations about a population based on a sample, using tools like hypothesis testing and confidence intervals.
- Key distinction: Descriptive statistics focus on what the data shows, while inferential statistics use data to make educated guesses about broader trends or future outcomes.
- Examples provided: The book uses real-life scenarios (e.g., weather prediction, medical studies) to illustrate both types of analysis.
6. What methods and advice does "Statistics 101" by David Borman give for collecting and ensuring the quality of data?
- Random sampling is crucial: The book stresses the importance of random selection to avoid bias and ensure that samples represent the population.
- Sample size matters: Borman recommends at least 100 data points for reliable results, noting that larger samples increase accuracy and reduce error.
- Diversity and response rates: Good data comes from diverse, representative samples and high response rates in surveys or studies.
- Blind questions and qualifiers: Including questions to detect bias or ineligible respondents helps improve data quality.
7. How does "Statistics 101" by David Borman explain probability, distributions, and the law of large numbers?
- Probability as frequency: Probability is described as the likelihood of an event occurring, based on past data or theoretical models.
- Types of probability: The book distinguishes between empirical (based on data) and subjective (based on experience) probability.
- Distributions explained: Borman covers binomial, normal, and Poisson distributions, showing how they model different types of data and events.
- Law of large numbers: The principle that larger samples yield more reliable averages and predictions is emphasized throughout the book.
8. What are the main types of data visualization and charts discussed in "Statistics 101" by David Borman, and how should they be used?
- Dot plots and bar charts: Used to display frequencies of discrete data and compare categories.
- Histograms and frequency polygons: Show the distribution and shape of continuous data, helping to identify centers and spreads.
- Stem-and-leaf plots and box plots: Useful for visualizing data while retaining individual values and identifying outliers.
- Pie charts and time series graphs: Pie charts show proportions within a whole, while time series graphs track changes over time.
9. How does "Statistics 101" by David Borman approach hypothesis testing, confidence intervals, and p-values?
- Hypothesis testing process: The book outlines steps for formulating null and alternative hypotheses, selecting significance levels, and making decisions based on data.
- Confidence intervals: These provide a range of values within which the true population parameter is likely to fall, with a specified level of confidence (e.g., 95%).
- P-values explained: P-values indicate the probability of observing results as extreme as those in your sample, assuming the null hypothesis is true.
- Decision-making: The book explains how to interpret p-values and confidence intervals to accept or reject hypotheses, using real-world examples.
10. What does "Statistics 101" by David Borman teach about regression analysis and predictive modeling?
- Simple and multiple regression: The book explains how to use regression to model relationships between variables and predict outcomes.
- Building predictive models: Borman shows how to use past data to forecast future events, emphasizing the importance of accurate, relevant data.
- Interpreting regression output: Key statistics like R-squared, adjusted R-squared, and standard error are explained for evaluating model quality.
- Applications: Examples include predicting stock prices, electricity usage, and the effects of advertising or environmental factors.
11. How does "Statistics 101" by David Borman address the ethics and limitations of statistical analysis?
- Potential for bias and misuse: The book warns about biased data collection, over-smoothing, and misinterpretation of results.
- Ethical responsibility: Statisticians must strive for objectivity, transparency, and honesty in data analysis and reporting.
- Limits of prediction: Borman acknowledges that statistics can’t predict rare or “black swan” events and that models are only as good as their assumptions and data.
- Critical thinking required: Readers are encouraged to question results, consider alternative explanations, and recognize the art as well as the science in statistics.
12. What are the best quotes from "Statistics 101" by David Borman and what do they mean?
- “Statistics is the measuring of data and interpreting that data to prove or disprove a point. That’s it!” — Emphasizes the fundamental purpose of statistics: to use data for evidence-based conclusions.
- “Good statistics can be made into great statistics if you can use information and data that are most relevant to the question.” — Highlights the importance of relevant, high-quality data for meaningful analysis.
- “There are three kinds of lies: lies, damned lies, and statistics.” — Quoting Disraeli, Borman reminds readers that statistics can be misused or misinterpreted, so skepticism and critical thinking are essential.
- “The goal of the predictive model is to use the past to predict the future.” — Summarizes the practical value of statistical modeling in decision-making and forecasting.
- “Statistics isn’t a pure science. It is the art of using math to interpret and predict outcomes.” — Acknowledges that while statistics relies on mathematics, interpretation and judgment play a crucial role.
About the Author

Download PDF
Download EPUB
.epub digital book format is ideal for reading ebooks on phones, tablets, and e-readers.








