

Key Takeaways
Read price and volume as footprints of changing market control
A market leaves clues. Richard Wyckoff developed his method by watching how prices moved and studying the activity behind those moves. The book’s central idea is that price and volume offer evidence about the changing contest between buyers and sellers. A chart is not a prediction machine; it is a record from which traders can build and revise explanations of what may be happening.
Look for context, not templates. The method combines the overall market setting, the shape of price structures, and the behavior of volume. Its patterns are guides, not forms every market must obey. Wyckoff’s practical aim is to identify which side appears to have the easier path, then avoid trading against that apparent control without good reason.
The method’s strongest claim is modest but useful: observed behavior can constrain a trader’s story about what is happening. This resembles scientific inference, where a model is judged by how well it explains evidence and updates when new evidence arrives. The caution is equally important: charts reveal transactions, not the identities or intentions of the traders behind them. Treating institutional motives as directly visible can turn a disciplined reading into a just-so story. The framework works best when its interpretations remain hypotheses, with clear evidence that could prove them wrong.
Classify the market before choosing a direction or trade
Four conditions organize the chart. Wyckoff’s price cycle moves through accumulation, an uptrend, distribution, and a downtrend. Accumulation and distribution are sideways ranges that may precede directional moves; trends are periods when price advances or declines. A pause in a trend can also be reaccumulation or redistribution, depending on whether the trend resumes upward or downward. Some ranges, however, are simply indecisive fluctuation.
Use the larger setting. Different time frames can show different parts of the cycle at once. A short-term decline may occur inside a longer-term uptrend, so the trader first identifies the larger structure and uses it to set a directional bias. This does not guarantee a profitable entry. It can, however, prevent a trader from treating every local move as a new major trend.
Classification is a form of compression: it reduces a busy chart to a small set of possible market states. That can improve decisions by making the next question more precise, such as whether a range is resolving or still balanced. The multitimeframe approach also resembles nested systems, where local behavior is constrained by broader conditions. Its cost is ambiguity: a range may only reveal its purpose after it breaks. A useful discipline is to keep competing interpretations alive until price behavior meaningfully favors one, rather than naming every pause in real time.
Judge trend strength by comparing waves, not drawing one line
Compare one move with another. Price travels in waves, with advances and pullbacks nested inside larger movements. The book recommends judging trend health by comparing their speed, distance, and depth. In an uptrend, stronger advances and shallower retreats suggest buyers remain effective. Smaller advances or increasingly deep pullbacks warn that momentum is weakening, though neither alone proves the trend has reversed. The same comparisons apply in a downtrend.
Treat lines as aids. Support, resistance, trend lines, and channels can help mark areas where buyers or sellers previously appeared. Repeated reactions make a level more informative, but a line break is not a verdict. A market can pause, change pace, or continue after breaking a line. The surrounding price and volume behavior matters more than the line by itself.
Relative comparisons are more informative than isolated measurements because they ask whether the market’s behavior is changing. That is a broadly useful analytical habit: compare current performance with a relevant baseline rather than treating a single observation as decisive. The method’s flexible treatment of trend lines is a strength, since chart boundaries are drawn by people and can create false certainty. A further safeguard is to define what counts as a meaningful change before acting; otherwise, the same sequence of waves can be interpreted differently after the outcome is known.
Treat volume as effort, then ask whether price made progress
Measure effort against result. In Wyckoff’s terminology, volume represents effort and price movement represents result. Strong activity accompanied by clear progress in the same direction suggests agreement between the two. Heavy volume with little movement, or a new price extreme on weaker activity, may indicate that the move is losing effectiveness. The book applies this comparison to individual bars, whole waves, and attempts to cross important price levels.
Absence also matters. A quiet pullback after a strong advance can suggest that sellers lack urgency. Likewise, a weak rally after a decline can indicate little buying interest. The method therefore reads both surges and silences. Volume is not automatically bullish or bearish: a high-volume bar records substantial trading, but the price’s response helps show whether that activity achieved its apparent aim.
The effort-result lens is a compact way to avoid equating activity with success. It echoes a general principle from engineering and organizational analysis: inputs matter only in relation to the output they produce. A burst of trading that fails to move price can be informative precisely because it raises a question about absorption or resistance. But volume alone cannot identify who initiated trades or why, and a quiet market can reflect many conditions. The insight is strongest as a comparative test, not a standalone signal.
Use trading ranges to infer campaigns, but don't assume intent
Ranges can build a cause. The law of cause and effect treats a sideways market as a possible period when positions are being accumulated or distributed before a larger move. In accumulation, large buyers are described as absorbing stock; in distribution, large sellers are described as absorbing demand. The longer range is presented as potentially supporting a larger subsequent move, because more time allows more trading and transfer of positions.
Not every pause is a campaign. The book stresses that some ranges are ordinary fluctuations without a clear professional interest. Sudden outside events can also move price without an extended preparatory range. Point and Figure charts can be used to estimate possible price objectives from the width of a range, but those estimates are not guarantees, and the author notes that construction choices can make such counts subjective.
Cause and effect gives sideways price action a useful interpretation: inactivity may conceal a process rather than signal that nothing matters. Yet duration is not a physical reservoir that mechanically determines the size of the next move. A longer range can reflect disagreement, low participation, or changing conditions, not simply a larger hidden campaign. The framework is most persuasive when range interpretation is supported by observable tests, volume behavior, and a convincing break. The word cause should remain a working model, not a promise of proportional returns.
Follow the range's sequence, while letting actual price action vary
Five phases create a map. Phase A marks an attempt to stop the prior trend. Phase B is the range-building period. Phase C tests whether opposing interest remains. Phase D shows movement toward the range boundary, and Phase E is the trend outside it. In an accumulation example, a selling climax may be followed by a rally and a test; distribution has a roughly mirrored sequence. These events help traders ask what the market is doing, not merely name a shape.
Keep the map flexible. The book warns that real structures do not always display every event in a textbook order. Some phases overlap, some clues are absent, and an apparent accumulation may prove to be redistribution. The function of an event matters more than perfect labeling. A proposed reading should gain confidence from several compatible clues, not from forcing one chart to match an ideal diagram.
This is a strong use of a framework: the phases act less like a recipe than a sequence of questions. Has the old trend weakened? Is the range testing supply or demand? Did the breakout hold? That structure helps organize attention without requiring certainty at every step. It also addresses a familiar risk in pattern analysis, namely seeing the expected pattern because one is looking for it. Flexibility is valuable, but it needs limits: without explicit criteria for changing a view, flexibility can become a way to explain away any outcome.
Trade the test after a sweep, not the drama of the breakout
A sweep may be a trap. In an accumulation range, a Spring is a temporary break below support that reverses back into the range. In distribution, an Upthrust After Distribution, or UTAD, is a temporary move above resistance that fails. The book interprets these as possible ways to draw in breakout traders and create liquidity for larger participants. A sweep can strengthen a scenario, but it is not proof that a reversal is underway.
Wait for evidence. A follow-up test with narrower price ranges and lower volume suggests less interest in continuing the false break. A valid breakout, by contrast, should show directional progress and avoid immediately falling back into the range. A busy breakout that quickly fails may be a shakeout; a quiet test that holds can offer a clearer decision point.
The focus on failed breakouts captures a real feature of markets: orders cluster around obvious highs and lows, so those levels can become consequential. The test shifts the question from whether price crossed a boundary to whether it can sustain the move. That is a better evidentiary standard than reacting to a dramatic candle. Still, the language of deliberate traps risks overstating intention. Similar patterns can arise from ordinary order flow and shifting liquidity. Traders can use the setup without needing to prove that anyone planned the deception.
Enter where confirmation, context, and invalidation line up
Choose the trade location deliberately. The book considers opportunities near the Phase C test, during Phase D movement, after a breakout test, and within a confirmed Phase E trend. Earlier entries can offer a larger potential move relative to the stop, but the structure is less developed and the reading is less certain. Waiting for a breakout and a successful retest provides more evidence, though price may already have traveled some distance.
Make the trigger observable. A strong directional bar, called a Sign of Strength or Sign of Weakness bar, can help time an entry when its range, volume, and close show intent. The trader should define where the scenario fails, often beyond the relevant swing or structure boundary. The book recommends quantifying entry rules and testing them rather than relying on an intuitive label alone.
The trade-off between early positioning and confirmation is a classic decision problem under uncertainty. More evidence usually reduces ambiguity, but it often comes at a worse price. The useful question is not which entry is universally best, but whether the chosen entry has a defensible relationship between potential reward and the point of invalidation. Quantified rules make that question testable. Backtests also need realistic costs and execution assumptions, or apparent precision can simply transfer uncertainty from chart reading into the test design.
Protect capital with predefined risk and measurable execution rules
Size the trade from the stop. Position size should reflect the distance between entry and the price that invalidates the idea, as well as the amount of the account at risk. The author recommends risking no more than 1 percent on a position. On a $5,000 account, that is $50. If a trade offers a 1-to-3 risk-reward ratio, the planned gain would be $150 against a possible $50 loss, before costs.
Plan the exit before entry. The book advises setting entry, stop-loss, and take-profit orders in advance to reduce emotional and technical errors. Stops should sit where the underlying scenario would be wrong, not wherever a trader hopes the price will turn. Entry methods, trailing stops, fees, and slippage affect results, so they should be evaluated through consistent records and testing.
Risk limits turn a market interpretation into a survivable experiment. The 1 percent guideline is a practical ceiling offered by the author, not a universal law; suitability depends on the trader, instrument, and strategy. The deeper principle is to separate the quality of an idea from the size of the bet. Even a plausible reading can fail, and repeated small losses can still accumulate. Recording actual fills and costs matters because theoretical risk-reward ratios are only useful when they resemble real execution.
Analysis
The book’s central contribution is not a claim that charts expose a hidden script. It is a disciplined vocabulary for reading transitions: a trend weakens, a range forms, opposing interest is tested, and a new direction either holds or fails. That vocabulary gives traders a way to delay commitment until several pieces of evidence agree. Its practical edge lies as much in what it discourages as in what it predicts: trading against a larger structure, treating every boundary break as decisive, or confusing high activity with effective movement.
The framework also carries a built-in epistemic hazard. Terms such as accumulation and distribution describe inferred campaigns, while the chart directly shows only prices and, depending on the market, reported volume. A trader can mistake a plausible interpretation for proof of institutional intention. The book’s insistence on flexible labeling helps, but flexibility can also let a framework explain almost any outcome after the fact. To remain useful, each scenario needs observable conditions that would weaken or invalidate it.
The method is best understood as a conditional decision process rather than a forecasting system. Its sequence of context, structure, test, confirmation, and risk control can be translated into rules and evaluated with historical data. That evaluation must account for execution costs and the quality of volume data; the text itself favors centralized markets when volume reliability matters. Even careful testing cannot guarantee future performance, but it can expose vague triggers and reveal whether an apparent edge survives beyond memorable chart examples.
The book’s strongest practical lesson is therefore methodological: interpret cautiously, act only when the evidence fits a preplanned setup, and cap the loss if the interpretation fails. The market does not owe a chart reader a clean schematic. A robust trader needs a framework that makes uncertainty visible, not one that makes uncertainty disappear.
Review Summary
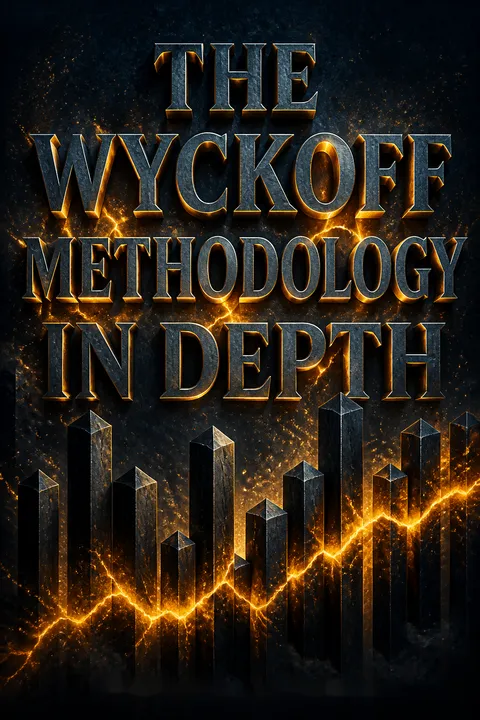
The Wyckoff Methodology in Depth receives mixed reviews, with an overall rating of 3.99 out of 5. Readers appreciate its in-depth coverage of market structure and Wyckoff principles, praising its wealth of information and insights into operator behavior. However, some criticize the repetitive content, poor English, and lack of clear direction. Many find it dense and recommend multiple readings to fully grasp the concepts. While some consider it an excellent resource for understanding market movements, others feel it lacks practical application and clarity in distinguishing between market phases.
People Also Read






Glossary
Wyckoff Methodology
Price-volume market analysisA method of interpreting financial markets through price movement, volume, and the changing balance between buyers and sellers. It organizes analysis around market cycles, trading ranges, recurring events, and phases. The method treats common structures as flexible guides rather than fixed patterns, then uses them to form conditional scenarios and trading decisions.
Law of Effort and Result
Compare volume with price progressA Wyckoff principle that treats trading volume as effort and price movement as result. When substantial activity accompanies clear progress, the two are considered in harmony. When high activity produces little progress, or price advances on diminishing activity, the mismatch may warn of resistance or weakening momentum. The comparison is interpretive, not a guarantee of reversal.
Law of Cause and Effect
Ranges may precede trendsA Wyckoff principle that links a period of market preparation with a subsequent price movement. Sideways ranges may contain accumulation or distribution, which the method treats as a possible cause of a later trend. A larger or longer range may support a larger projected move, but range duration does not guarantee a specific outcome or target.
Change of Character (CHoCH)
Shift in market behaviorA meaningful change in how price behaves, used to identify a possible transition between market conditions. In a Wyckoff structure, an initial change may mark a move from trend to range; a later change may signal movement from the range toward a new trend. The term describes evidence of a shift, not certainty that the shift will persist.
Spring
Failed break below supportA potential accumulation event in which price moves below a support area and then returns into the trading range. The move can test for remaining selling interest and may create liquidity for a reversal. Its interpretation depends on context and follow-up behavior. A dip below support alone is not enough to establish a Spring or confirm that an uptrend will follow.
Upthrust After Distribution (UTAD)
Failed break above resistanceA potential distribution event in which price rises above the range’s highs, then returns into the range. The move tests buying interest and may precede a decline if sellers regain control. A UTAD is assessed through its setting and subsequent price action, not simply by a brief move above resistance. A test can strengthen the interpretation.
Sign of Strength (SOS)
Bullish move showing demandA Wyckoff label for a strong upward movement that indicates demand is gaining control. In a typical accumulation structure, the movement advances toward or beyond the range’s resistance and may help signal a transition to an uptrend. A successful interpretation depends on the surrounding structure and whether a subsequent pullback holds, rather than on one rising bar alone.
Last Point of Support (LPS)
Pullback where buyers reappearA Wyckoff term for a pullback in an accumulation or rising market that fails to drive price materially lower before buyers return. It can occur after a Spring, during a move within the range, or after an upward breakout. Traders may treat it as a potential entry area, provided price behavior supports the bullish scenario and risk can be defined.
Last Point of Supply (LPSY)
Rally where sellers reappearA Wyckoff term for a rally in a distribution or falling market that fails to continue higher before sellers regain control. It may occur after an Upthrust After Distribution, within a range, or following a downward breakout. It can offer a potential short-entry area, but its usefulness depends on context, a defined invalidation point, and evidence that selling remains dominant.
FAQ
What's "The Wyckoff Methodology in Depth" about?
- Overview: "The Wyckoff Methodology in Depth" by Rubén Villahermosa is a comprehensive guide on trading financial markets using the Wyckoff Method, a technical analysis approach.
- Focus: The book emphasizes logical trading strategies based on the principles of supply and demand, cause and effect, and effort and result.
- Structure: It is divided into parts that cover market movements, the Wyckoff Method, fundamental laws, accumulation and distribution processes, events, phases, trading strategies, and case studies.
- Purpose: The book aims to equip traders with the knowledge to interpret market actions and make informed trading decisions.
Why should I read "The Wyckoff Methodology in Depth"?
- In-depth Analysis: The book provides a detailed exploration of the Wyckoff Method, making it suitable for traders seeking to deepen their understanding of market dynamics.
- Practical Application: It offers practical insights and strategies that can be applied to real-world trading scenarios, enhancing decision-making skills.
- Comprehensive Coverage: With its structured approach, the book covers everything from basic concepts to advanced trading techniques, making it a valuable resource for both beginners and experienced traders.
- Author's Expertise: Rubén Villahermosa brings his extensive knowledge and experience in technical analysis and trading strategies to the book, providing readers with credible and actionable insights.
What are the key takeaways of "The Wyckoff Methodology in Depth"?
- Market Movements: Understanding how markets move through waves, price cycles, and trends is crucial for effective trading.
- Wyckoff Method: The methodology involves analyzing market structures, fundamental laws, and the processes of accumulation and distribution.
- Trading Strategies: The book emphasizes the importance of context, structures, and trading areas in making informed trading decisions.
- Case Studies: Real-world examples illustrate the application of the Wyckoff Method, providing practical insights into its effectiveness.
What is the Wyckoff Method according to Rubén Villahermosa?
- Technical Analysis Approach: The Wyckoff Method is a technical analysis approach that focuses on understanding market movements through the principles of supply and demand.
- Three Fundamental Laws: It is based on the laws of supply and demand, cause and effect, and effort and result, which help traders interpret market actions.
- Market Structures: The method involves analyzing market structures such as accumulation and distribution to predict future price movements.
- Flexibility and Objectivity: The Wyckoff Method combines flexibility in analyzing market conditions with objective principles to guide trading decisions.
How do markets move according to "The Wyckoff Methodology in Depth"?
- Wave Patterns: Markets move in waves of different sizes, which are not random but reflect the underlying supply and demand dynamics.
- Price Cycles: The market follows a cycle of accumulation, uptrend, distribution, and downtrend, which traders can use to identify trading opportunities.
- Trend Analysis: Trends are categorized into bullish, bearish, and lateral, and understanding these trends is key to trading in harmony with the market.
- Trend Assessment: Tools such as strength/weakness analysis and lines help traders assess the health of trends and make informed decisions.
What are the three fundamental laws in the Wyckoff Method?
- Law of Supply and Demand: This law states that price movements are determined by the balance between supply and demand, with prices rising when demand exceeds supply and falling when supply exceeds demand.
- Law of Cause and Effect: It suggests that market movements are the result of a cause, such as accumulation or distribution, and the effect is the subsequent trend.
- Law of Effort and Result: This law emphasizes the relationship between volume (effort) and price movement (result), with harmony indicating trend continuation and divergence suggesting a potential reversal.
What is the process of accumulation and distribution in the Wyckoff Method?
- Accumulation: This process involves large traders absorbing available stock from the market, creating a base for a future uptrend.
- Distribution: In contrast, distribution involves large traders selling stock, leading to a market top and a subsequent downtrend.
- Characteristics: Accumulation is characterized by decreasing volume and volatility, while distribution shows high volume and volatility.
- Market Control: Understanding these processes helps traders identify when the market is controlled by buyers or sellers, guiding their trading decisions.
What are the key events in the Wyckoff Method?
- Preliminary Stop: The first attempt to halt a trend, indicating a potential market turn.
- Climax: The culmination of a trend, marked by a significant volume and price movement.
- Reaction: A movement in the opposite direction, signaling a change in market sentiment.
- Test: An evaluation of market commitment, confirming the presence or absence of interest in a particular direction.
- Shaking: A deceptive move to expel weak traders, often preceding a trend movement.
How are phases used in the Wyckoff Method?
- Phase A: Stops the previous trend and returns the market to a state of balance.
- Phase B: Builds the cause for the subsequent effect, involving stock absorption or distribution.
- Phase C: Tests the market's commitment, often involving a shakeout or upthrust.
- Phase D: Initiates the trend movement within the range, confirming the direction.
- Phase E: Represents the trend movement out of the range, driven by the imbalance created in previous phases.
What trading strategies are recommended in "The Wyckoff Methodology in Depth"?
- Contextual Trading: Emphasizes trading in favor of the larger structure and avoiding trades on the wrong side of the market.
- Structure Analysis: Focuses on understanding market structures to identify potential trading opportunities.
- Trading Areas: Identifies key trading areas that act as price magnets, providing liquidity for large traders.
- Primary Positions: Recommends trading in specific phases and events, such as Phase C (shakeout), Phase D (trend within range), and Phase E (trend out of range).
What are some of the best quotes from "The Wyckoff Methodology in Depth" and what do they mean?
- "The price does not move between two points in a straight line; it does so in a wave pattern." This quote emphasizes the importance of understanding wave patterns in market movements.
- "A cycle is considered to be complete when all stages of the cycle are observed: accumulation, uptrend, distribution, and downtrend." It highlights the cyclical nature of markets and the need to recognize these stages for effective trading.
- "The Wyckoff method has passed the test of time." This underscores the enduring relevance and effectiveness of the Wyckoff Method in trading.
- "The key to everything is in the types of orders that are executed." This quote points to the significance of understanding order types and their impact on market movements.
How does "The Wyckoff Methodology in Depth" apply to real-world trading scenarios?
- Case Studies: The book includes case studies of various financial instruments, such as the S&P500, Bitcoin, and currency pairs, demonstrating the application of the Wyckoff Method.
- Practical Insights: These examples provide practical insights into how the methodology can be used to analyze market conditions and make informed trading decisions.
- Market Fractality: The book illustrates the concept of market fractality, showing how similar structures and patterns appear across different time frames and assets.
- Adaptability: The Wyckoff Method's adaptability to various market conditions and instruments is highlighted, reinforcing its value as a versatile trading approach.
About the Author
Other books by Rubén Villahermosa

Download PDF
Download EPUB
.epub digital book format is ideal for reading ebooks on phones, tablets, and e-readers.








