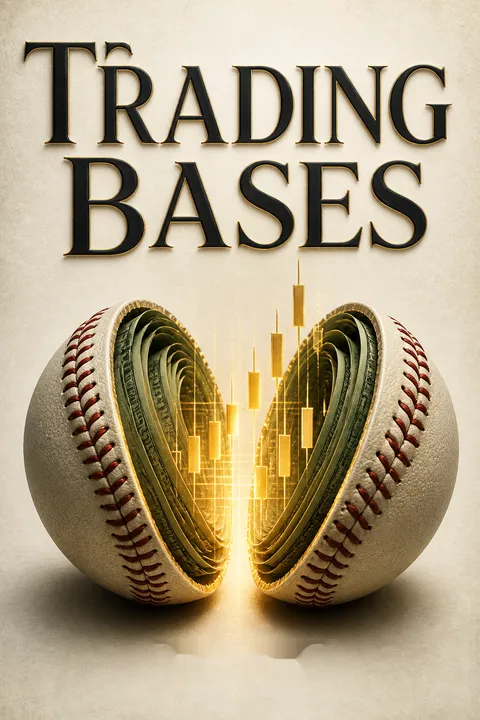


Key Takeaways
A broken leg sent a Wall Street trader searching for baseball's hidden edge
A life-changing accident. In January 2011, an ambulance struck Joe Peta while he crossed a Manhattan street. His leg was badly broken, surgery left him wheelchair-bound, his family was across the country, and he lost his trading job weeks after returning to work. During sleepless nights, he replayed the small coincidence that had brought him to the crossing minutes earlier.
Baseball became a project. Unable to travel or concentrate on much, Peta turned to baseball statistics and trading, building a model to find mispriced betting odds. The daily work gave his attention somewhere to go. He came to see that the sport itself, not just the spreadsheets or wagers, had helped reconnect him with energy and purpose.
What's striking is how the model begins as both an analytical experiment and a structure for recovery. A difficult event can leave a person trapped in counterfactual questions, such as whether a different choice would have prevented it. A demanding, bounded project can redirect attention toward decisions that remain possible. That is not evidence that adversity is beneficial, or that a spreadsheet treats trauma. It is a portrait of how a familiar passion can make purposeful work emotionally available when ordinary routines have collapsed.
Separate repeatable skill from the lucky timing of hits
Runs depend on timing. Peta calls it cluster luck when a team's hits happen to bunch together when runners are already on base, producing more runs than its overall hitting ability would predict. The 2010 Tampa Bay Rays scored 802 runs, despite ordinary-to-good rankings in major offensive measures. A regression using on-base percentage, slugging, and isolated power estimated that their hitting should have produced about 78 fewer runs.
Situations magnify noise. Major League hitters as a whole improved with runners on base, but Tampa's improvement was much larger. Carl Crawford's batting line also surged in those situations, far beyond his earlier career pattern, while his overall season remained consistent with his established level. Peta treated that extreme situational jump as nonrepeatable luck, not newly discovered clutch ability.
This is a useful distinction between a player's overall capacity and the distribution of when successful events occur. In many fields, a strong outcome depends not only on how many good events happen, but on whether they arrive in a useful sequence. That can make a team look more talented than it is. The caution is that calling a result luck requires a credible baseline and enough observations. A surprising split may be noise, but the label should follow analysis, not replace it.
Use run differential to judge teams, not standings alone
Runs predict wins. Bill James's baseball Pythagorean theorem estimates a team's winning percentage from runs scored and runs allowed: runs scored raised to the 1.83 power, divided by that figure plus runs allowed raised to the same power. The formula turns the season's accumulated scoring into a rough measure of team quality, less sensitive to how close individual games happened to be.
The standings can mislead. Houston won 76 games in 2010, nearly eight more than its run totals suggested. After adjusting for its favorable run-scoring and pitching luck, Peta estimated that the same performance reflected a team closer to 66 wins. His point was not that the formula knows the future exactly, but that actual wins contain noise that run differential can help expose.
The value of this model is its disciplined compression: a season contains thousands of plays, yet aggregate runs scored and allowed summarize much of the information relevant to wins. Similar expected-outcome measures in other sports try to distinguish process from the final scoreboard. The limitation is that a compact statistic can hide structure. Run totals do not explain injuries, roster changes, or a team's changing talent, so they are a starting estimate rather than a complete forecast.
Project the roster that will play, not last year's logo
Teams change between seasons. A forecast based only on last year's wins misses aging, injury risk, and players arriving or leaving. Peta used PECOTA, a projection system that compares a player with historical players of similar age and performance, and WAR, a measure of wins contributed above a readily available replacement player.
The Phillies illustrate the arithmetic. Their starting pitchers produced 18.6 WAR in 2010; projections put the 2011 rotation at 25.6, helped by Cliff Lee and a full season from Roy Oswalt. Yet the hitters were projected to lose 5.1 WAR, in part because Jayson Werth had left and the remaining core was aging. A strong pitching upgrade therefore did not automatically mean a large overall improvement. Forecast the actual components, then combine them.
This is an argument for explicit, component-level forecasting rather than treating a franchise as a stable unit. The same logic applies when evaluating a company after executive turnover or a team after key departures: the name persists, but the productive system has changed. Projection systems make hidden assumptions visible, which is valuable even when their estimates are wrong. Their historical comparisons can also mislead when a player has few true analogues or when an unusual change in role alters the trajectory.
Price pitchers by controllable skills, not yesterday's ERA
Results are not all skill. Research known as DIPS argues that pitchers have substantial control over strikeouts, walks, and home runs, but much less control over whether other balls in play become hits. FIP estimates performance from strikeouts, walks, and home runs; xFIP replaces a pitcher's home-run rate with the league average to reduce the influence of short-term variation.
SIERA refines the forecast. Skill-interactive ERA uses strikeouts, walks, home runs, and ground-ball tendencies, including interactions among them, to estimate future earned-run performance. Bronson Arroyo had ERAs of 3.84 and 3.88 in the two seasons before 2011, but his pre-season SIERA projected 4.56. His ERA ended at 5.07. Peta used the gap between reputation and underlying skills to find early betting value against him.
The central lesson is to predict the mechanisms producing an outcome, rather than extrapolating the outcome itself. That resembles measurement in medicine, where a noisy symptom can be less informative than the process generating it. Still, these are population-level tools, not proof that every pitcher is interchangeable. Defense, ballpark, and individual pitching styles matter, and a statistical measure can omit relevant context. Its practical value depends on whether it forecasts better than the information already reflected in the betting line.
Baseball's money line aligns bets with the team's real objective
Bet the probability, not a margin. Football and basketball betting commonly uses a point spread, which can make a team's ideal strategy conflict with the bettor's interest. Baseball uses a money line: a price that reflects how likely each team is to win. The manager still wants the same thing as the bettor, a victory.
The costs can be lower. Peta calculates that a standard -110 spread bet carries about 4.76 percent in combined implied odds, while the average 2011 baseball bet carried roughly 1.78 percent. Baseball also offered about 2,430 regular-season games, compared with 256 NFL games, giving a model many more chances to apply its estimates. A lower bookmaker margin is not a guaranteed profit, but it leaves less friction for a bettor who can estimate probabilities better than the market.
The structure matters because incentives shape behavior. When participants are rewarded for the same outcome, the wager is simpler to reason about than one that pays on a margin the team may have no reason to pursue. More games also provide a larger sample for testing a method, although volume cannot rescue a systematically miscalibrated model. A small edge estimated with false confidence is still a bad bet. The market price must be compared with a defensible probability, not merely with personal conviction.
Keep every wager small enough to survive being wrong
Size bets by edge. Peta wagered a larger share of the fund when the model showed a wider gap between its estimated probability and the money line. The schedule ranged from 10 basis points of capital for edges under 3 percent to 2 percent for edges above 15 percent. For favorites, the stake was set to win that amount; for underdogs, it was the amount risked.
Preserve the chance to continue. The model lost 4.16 percent in June and 7.99 percent in July 2011, then gained 8.51 percent in August and 11.63 percent in September. It finished the regular season up 30.18 percent on daily betting, with futures bringing the total to 32.83 percent. These are the book's reported returns, not proof of a durable edge. The operating principle is to avoid a single wager that can end the experiment.
Position sizing is where a correct idea meets the possibility of being wrong. Finance formalizes this through risk budgets and fractional versions of Kelly-style allocation, but the book's emphasis is more basic: survival preserves access to future opportunities. This matters especially when estimated edges are uncertain or correlated across many bets. A long losing streak can reflect variance, a flawed model, or both. Small stakes reduce ruin risk, but they do not make the underlying probability estimate reliable.
Use win probability to place talent at baseball's decisive moment
Leverage changes the decision. A manager may save a closer for the ninth inning because saves are conventionally attached to that frame. Peta argues that the best reliever should instead face the most consequential situation, even if it comes earlier. In one Yankees game, manager Joe Girardi brought in David Robertson with the bases loaded rather than Mariano Rivera; the lead disappeared before Rivera entered in the ninth.
Small ball can sacrifice upside. In Peta's example, a visiting team down two runs in the eighth, with runners on first and second and nobody out, has a 31 percent chance to win. If it ties the game by inning's end, that rises to 39 percent. If a bunt and sacrifice fly instead leave the team down one, its chance falls to 13 percent. A tidy-looking run can be a strategically poor result.
This is decision theory made visible: the best choice depends on how each possible action changes the probability of the actual objective. Conventional statistics often reward an easily counted event, such as a save, rather than the value of the underlying decision. The same principle appears in emergency response, where scarce resources should go to the moment of greatest expected impact. Win-probability estimates are still model-dependent, and managers must account for fatigue and future innings, but tradition alone is not a strategy.
Evaluate employees by repeatable skill, not raw P&L or yearly wins
Outcomes need context. A pitcher's win total depends partly on how many runs teammates score. A portfolio manager's return depends on both stock selection and overall market exposure. Peta describes a manager whose stock picks added value, while frequent shifts in market exposure detracted from it. The fund's headline return concealed the difference between those skills.
Build better scorecards. Peta proposed ALARM, or additional loss above replacement monkey, to compare a trader's liquidation decisions with a simple replacement-level pace. TUPAC, trader upside above cost, aimed to compare trading contributions after relevant costs. The broader lesson is to identify which repeatable abilities produced a result before rewarding or dismissing the person attached to it.
This approach connects baseball's player evaluation to organizational psychology and causal attribution. People often receive credit for outcomes partly produced by resources, timing, or teammates, while invisible contributions go unrecognized. Separating skill dimensions can improve hiring, coaching, and compensation. Yet a metric can become a new target and invite gaming, a problem familiar from performance management. Good scorecards need transparent definitions, enough observations, and periodic review of whether the measure still tracks the value the organization actually wants.
Update forecasts with new evidence, but distrust streaks
Pre-season views should evolve. Baseball Prospectus co-founder Rany Jazayerli found that after roughly 35 to 40 games, a team's current-season record predicts more than half of its final record. Peta therefore gave in-season performance increasing weight, but used a Pythagorean estimate based on runs, adjusted for cluster luck, rather than accepting the raw record at face value.
The Twins tested that judgment. Minnesota went 33-22 across June and July, despite scoring and allowing 239 runs over that span. The model saw a roughly .500 team, yet repeatedly bet against the Twins and lost 14.56 percent on those bets before their September collapse. The experience shows both why a forecast must respond to new information and how stubborn confidence in a model can mistake a bad prediction for temporary noise.
This is a practical Bayesian problem: a forecast should combine prior expectations with new evidence, giving more weight to information that is reliable and relevant. Runs scored and allowed can be more informative than a short win streak, but injuries and lineup changes are real signals, not statistical clutter. The book's Minnesota example is especially useful because the model's eventual vindication does not erase the cost of being wrong for months. Updating rules should be specified before results arrive, reducing hindsight-driven exceptions.
Use baseball's numbers without mistaking the game for its numbers
A field can still surprise. During recovery, Peta took his young daughter Calista to a San Francisco Giants game. As they climbed toward their seats, she caught sight of the grass and exclaimed at the first glimpse of the field. For him, the moment echoed his own childhood arrival at a ballpark and the memories of baseball shared with his father.
Analysis deepened the attachment. The model made every day's games into a probability puzzle, but its spreadsheets were not the reason baseball mattered. Old broadcasts, family stories, the sound of a pitcher's great curveball, and the emotional force of watching a child encounter the game all belonged to a different kind of value. The book ends by holding both truths together: baseball can be analyzed rigorously and remain larger than any forecast.
The book's strongest counterweight to its technical argument is the author's continuing affection for what cannot be priced. Quantification need not flatten experience; it can focus attention on details a casual observer misses, while leaving beauty and memory intact. This distinction resembles the difference between instrumental value, what an activity produces, and intrinsic value, what makes the activity worth doing. The caveat is important: a profitable wager may intensify attention, but it can also turn a shared pastime into a ledger. The two forms of engagement need not be confused.
Analysis
Trading Bases works because it makes a technical claim personal. Peta does not begin as a detached quant explaining a model. He begins injured, isolated, and preoccupied with the small decisions that might have changed his fate. Baseball analysis gives that restless attention a useful destination. The resulting narrative lets readers see statistical reasoning as both a method for evaluating bets and a way of recovering agency.
The intellectual through-line is attribution. A team's record is not identical to its talent; a pitcher's ERA is not identical to his skill; a trader's profit is not identical to his contribution. The book repeatedly asks what part of an outcome is repeatable, what part is context, and what part is luck. Its strongest practical contribution is not any single formula, but the habit of decomposing performance before making a forecast or rewarding a performer.
The same discipline also exposes a limitation. A model's edge is a difference between an estimated probability and a market price, so error in either estimate can erase the apparent advantage. Peta's reported 2011 profits and the strong 2012 result are compelling demonstrations, not a long record sufficient by themselves to establish that the edge is stable. A rigorous investor would want out-of-sample testing, probability calibration, sensitivity analysis, and accounting for how the betting market changes. The book's own losing months make this caution concrete.
Its broader argument reaches beyond sports. Baseball's long seasons and relatively isolatable events make it unusually amenable to statistical analysis, but the underlying questions apply to finance and management: Are incentives aligned? Are people being judged on skills they control? Can an organization tolerate volatility without risking its survival? The answer is not to worship metrics. It is to use them to correct intuition, then remember what they cannot measure.
Review Summary
Reviews of Trading Bases are generally positive, with readers praising Peta's blend of baseball analytics, Wall Street insights, and personal anecdotes. Many appreciate his explanations of sabermetrics and sports betting strategies, finding the book both educational and entertaining. Some readers particularly enjoy Peta's humor and storytelling ability. While a few found certain sections too technical or disjointed, most recommend the book to those interested in baseball, finance, or sports betting. Overall, readers appreciate Peta's unique perspective and engaging writing style.
People Also Read








Glossary
cluster luck
Runs from clustered hitsA term Peta uses for unusually favorable or unfavorable timing in a team's hits. A team may produce more runs than its overall hitting quality predicts because hits occur disproportionately when runners are already on base. The concept treats such situational spikes as likely to regress rather than as proof of a newly acquired clutch skill.
Pythagorean theorem
Wins estimated from runsBill James's formula for estimating a baseball team's winning percentage from runs scored and runs allowed. In the version used by Peta, each run total is raised to the 1.83 power, then runs scored are divided by the sum of the two powered totals. It is a baseball forecasting formula, not the geometric theorem.
PECOTA
Historical player projection systemA player projection system developed by Nate Silver at Baseball Prospectus. PECOTA compares a current player with historical players who shared relevant traits, including position, age, and past performance, then uses those analogues to estimate future performance. Peta uses its projections to account for aging and to estimate how roster changes affect team strength.
WAR
Wins above replacementWins Above Replacement estimates how many wins a player contributes beyond what a team might receive from a readily available substitute, such as a bench player, minor leaguer, or waiver pickup. Different baseball analysts calculate WAR somewhat differently. Peta uses it to compare player contributions and translate roster changes into expected effects on wins.
DIPS
Pitching independent of defenseDefense Independent Pitching Statistics is research associated with Voros McCracken. It argues that pitchers largely control strikeouts, walks, and home runs, while the outcomes of many other balls put in play are less under their control. The finding prompted new ways to separate a pitcher's repeatable skills from defensive support and random variation.
FIP
Defense-independent pitching estimateFielding-Independent Pitching estimates a pitcher's performance primarily from strikeouts, walks, and home runs, the outcomes treated as more directly controlled by the pitcher. It helps compare underlying pitching performance with earned-run average. When the two diverge, the difference may point to defense or variation in balls in play.
xFIP
FIP with normalized home runsExpected Fielding-Independent Pitching modifies FIP by replacing a pitcher's actual home-run rate with a league-average rate. Since home-run rates fluctuate more from year to year than strikeout and walk rates, this adjustment can make xFIP a better predictor of future earned-run performance than current ERA or FIP.
SIERA
Skill-interactive ERA forecastSkill-Interactive Earned Run Average estimates a pitcher's future earned-run performance using controllable factors such as strikeouts, walks, home runs, and ground-ball rate. Its formula also accounts for interactions among those factors. Peta adopts it as a pitcher-evaluation tool because it forecasts future ERA more effectively than relying on recent ERA alone.
money line
Price on a team's winA baseball betting price that expresses the cost or potential return for wagering on a team to win, without a point spread. The favorite receives a negative price and the underdog a positive one. Each price implies a probability, and the combined implied probabilities exceed 100 percent by the bookmaker's margin.
dime line
Ten-cent price differenceThe typical ten-cent gap between the price offered on a baseball favorite and the corresponding underdog. Peta argues that this pricing structure makes the bookmaker's margin smaller on many baseball wagers than the standard margin on point-spread bets in football and basketball.
ALARM
Trading loss versus replacementPeta's acronym for additional loss above replacement monkey. It compares a trader's choices while liquidating a position with a simple replacement-level pace, represented jokingly by a monkey following a basic schedule. The measure was intended to identify when a trader's judgment added losses rather than value.
TUPAC
Trader value after costsPeta's acronym for trader upside above cost. It is a proposed way to compare traders after accounting for relevant costs and differences in the resources, sector, and business conditions that support their trading. Its purpose is to evaluate value creation more fairly than raw profit-and-loss totals.
FAQ
What's Trading Bases about?
- Intertwines Wall Street and Baseball: Trading Bases by Joe Peta explores the intersection of Wall Street trading strategies and baseball analytics, detailing how Peta applied sabermetric principles to sports betting.
- Personal Journey: The narrative follows Peta's personal experiences, including his recovery from a severe leg injury and his transition from Wall Street to betting on baseball.
- Statistical Analysis: The book emphasizes the importance of data analysis in making informed decisions, both in trading and betting, using various metrics and models to predict outcomes.
Why should I read Trading Bases?
- Unique Perspective: The book offers a fresh take on sports betting by integrating financial principles and statistical analysis, appealing to both sports fans and finance enthusiasts.
- Educational Value: Readers gain practical advice on building a betting model based on sabermetrics, enhancing their analytical thinking and understanding of real-world applications.
- Engaging Storytelling: Filled with personal anecdotes and humor, Peta's passion for baseball and trading shines through, making complex topics accessible and enjoyable.
What are the key takeaways of Trading Bases?
- Importance of Data: Successful betting relies heavily on data analysis and understanding player performance metrics, such as WAR and SIERA.
- Risk Management: Peta highlights the need for a systematic approach to capital allocation and the importance of not letting emotions dictate decisions.
- Market Inefficiencies: The book illustrates how to identify and exploit inefficiencies in betting markets, similar to finding mispriced stocks in trading.
How does Joe Peta create his betting model in Trading Bases?
- Data-Driven Approach: Peta builds his model using sabermetric principles, analyzing player performance data and team statistics to predict game outcomes.
- Pythagorean Theorem Application: He applies the Pythagorean theorem to estimate a team's winning percentage, adjusting for cluster luck to refine predictions.
- Continuous Improvement: Throughout the season, Peta adjusts his model based on actual game results, refining his predictions and betting strategies.
What is "cluster luck" in Trading Bases?
- Definition of Cluster Luck: Cluster luck refers to a situation where a team scores more runs than expected due to random occurrences rather than skill.
- Statistical Analysis: Peta quantifies cluster luck by comparing a team's actual runs scored to expected runs based on metrics like on-base percentage.
- Implications for Betting: Understanding cluster luck helps bettors make informed decisions, highlighting teams that may regress to their true performance levels.
How does Peta manage risk in his betting strategy in Trading Bases?
- Structured Betting Approach: Peta employs a systematic method for determining bet sizes based on the perceived edge of each game.
- Bet Sizing: He outlines a specific bet-sizing schedule that adjusts the amount wagered based on the model's confidence in each game.
- Focus on Capital Preservation: Peta emphasizes preserving capital to withstand losing streaks and maintain the ability to capitalize on future opportunities.
What role does sabermetrics play in Trading Bases?
- Foundation of the Model: Sabermetrics provides the analytical framework for Peta's betting model, enhancing the accuracy of his predictions.
- Identifying Value: By applying sabermetric principles, Peta can identify undervalued teams and players, giving him an edge over oddsmakers.
- Evolution of Baseball Analysis: The book illustrates how sabermetrics has transformed baseball analysis, influencing team management and betting strategies.
What is the significance of the Pythagorean theorem in Trading Bases?
- Win-Loss Prediction: Peta uses the Pythagorean theorem to estimate a team's expected win-loss record based on runs scored and allowed.
- Identifying Value: Comparing a team's actual performance to its expected performance helps find value in betting lines.
- Cluster Luck Analysis: The theorem aids in analyzing "cluster luck," allowing bettors to make more informed decisions about future performance.
How does Peta's personal story intertwine with the betting narrative in Trading Bases?
- Overcoming Adversity: Peta's recovery from a severe leg injury parallels his exploration of baseball and betting, adding depth to the narrative.
- Passion for Baseball: His love for baseball motivates him to create his betting model and engage with the sport on a deeper level.
- Connection with Family: Experiences with his daughters and their shared love for baseball highlight the intergenerational connections the sport fosters.
What are the challenges Peta faces while betting on baseball in Trading Bases?
- Market Adjustments: Oddsmakers adjusting lines based on team performance makes it harder to find value bets, requiring continuous model adaptation.
- Injury Impact: Injuries to key players can drastically affect team performance, complicating predictions and requiring strategy adjustments.
- Emotional Strain: The pressure of betting can create emotional challenges, emphasizing the importance of maintaining a disciplined mindset.
What are the best quotes from Trading Bases and what do they mean?
- “You see, you spend a good piece of your life gripping a baseball and in the end it turns out that it was the other way around all the time.”: Reflects Peta's deep connection with baseball and how it has shaped his life.
- “Every dollar counts.”: Underscores the importance of risk management and careful decision-making in both investing and betting.
- “Markets can remain irrational longer than you can remain solvent.”: Highlights the unpredictability of markets and the necessity of a sound strategy.
What is SIERA and why is it important in Trading Bases?
- Definition of SIERA: SIERA stands for Skill-Interactive Earned Run Average, evaluating a pitcher's performance based on strikeouts, walks, and ground-ball rates.
- Predictive Value: Peta uses SIERA to predict future performance, aiding in informed betting decisions.
- Integration into the Model: SIERA is incorporated into Peta's betting model, enhancing its accuracy and profitability.
Download PDF
Download EPUB
.epub digital book format is ideal for reading ebooks on phones, tablets, and e-readers.








