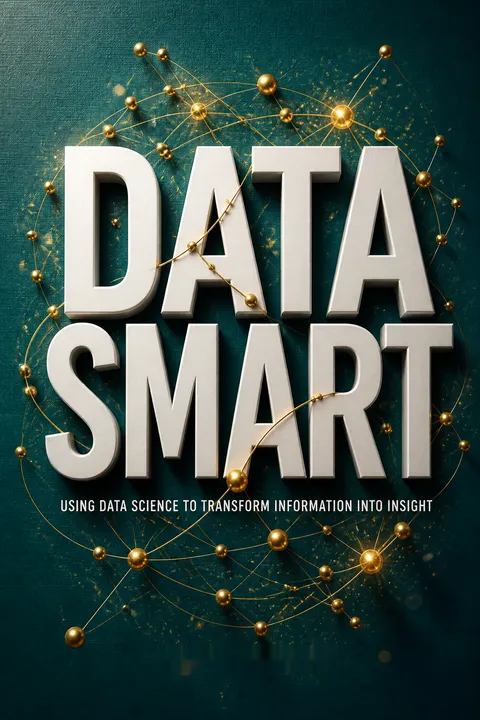


Key Takeaways
Start with the business decision, not the fashionable data tool
Define the real problem. Data science, in this book, means turning data through mathematics and statistics into useful insight, decisions, or products. The starting point is not a purchase order for new software. It is a business question: what decision needs to improve, and what information could change it? A scene from the film Sneakers illustrates the difference. A character asked to defeat a keypad instead kicks in the door. The actual goal was entering the room, not solving the keypad.
Prototype before scaling. Spreadsheets let analysts inspect data and test techniques without first learning a programming environment. They are useful for exploration, not necessarily for production. The book’s broader aim is to help businesspeople recognize the right analytical approach and evaluate technical recommendations.
What's striking is how much analytical failure can begin before any model is built. A well-specified calculation can still answer the wrong question, especially when a request arrives already framed by someone else's assumptions. The keypad example is a compact lesson in problem formulation: distinguish the desired outcome from the proposed method. A useful next question is who will act on the result. If no decision changes, even technically impressive analysis may be ornamental.
A cluster is only as meaningful as its features and distance
Similarity needs a definition. Clustering groups observations without labels supplied in advance. In k-means, each customer is assigned to the nearest center, and the centers move to reduce the overall distance. The wine retailer example starts with 100 customers and 32 offers. A purchase matrix records each customer’s buys as 1s and non-buys as 0s. That representation, and the chosen distance rule, shape the groups the algorithm can discover.
Purchases carry unequal evidence. Ordinary Euclidean distance treats a shared non-purchase like a shared purchase. Cosine distance emphasizes overlap in purchases instead, which better suits sparse buying records. The resulting groups reveal interpretable patterns such as Pinot Noir fans, low-volume buyers, and customers favoring sparkling wine. A silhouette score helps compare cluster assignments, but human interpretation still matters.
The deeper lesson is that an algorithm does not uncover customer segments independently of the analyst. Feature selection and distance encode a theory of what counts as resemblance. In purchase data, a shared action is often stronger evidence of preference than a shared absence of action, though neither rule is universal. Clusters are best treated as hypotheses for investigation, not natural kinds. A segment that cannot guide a distinct decision may be mathematically tidy and commercially useless.
Naive Bayes turns messy text into useful probabilities with crude assumptions
Count words, compare classes. Naive Bayes classifies a document by estimating how likely its words are under each known category. For a new tweet, it compares the probability of the words appearing in a Mandrill email-service tweet with their probability in tweets about other meanings of “mandrill.” The method assumes words occur independently, a plainly unrealistic simplification, yet it can still classify usefully because the model needs to compare scores rather than understand language as a person does.
Prepare and stabilize counts. The example lowercases tweets, removes punctuation, splits text into tokens, and counts each token by category. Adding one to every count prevents unseen words from forcing a class score to zero. Taking logarithms turns tiny products of probabilities into manageable sums. On the sample test set, the spreadsheet model classified 19 of 20 tweets correctly.
What's striking is the useful gap between a model's assumptions and its practical purpose. Naive Bayes does not understand irony, word order, or context, but can still separate categories when their vocabularies differ enough. That makes it an excellent baseline: simple enough to inspect, fast to build, and revealing about whether the signal exists at all. Its apparent success should not be mistaken for language comprehension, and performance on 20 examples is a demonstration, not a guarantee.
Use optimization when data must choose what happens next
Prediction is not a decision. A predictive model estimates what may happen. Optimization chooses an action under limits. In a juice-blending example, a company selects how much orange juice to buy from suppliers so that demand and taste specifications are met at minimum cost. The model’s objective is cost; its constraints include supply, monthly demand, color, flavor, and a requirement to buy at least 40 percent from Florida growers.
Make rules explicit. Linear programming represents decisions, an objective, and constraints using linear relationships. Its feasible solutions form a geometric region, and the simplex method searches its corners for an optimum. Integer and binary decisions handle realities such as whole units or whether a supplier is used. A Big M constraint can connect a yes-or-no decision to a quantity without writing a nonlinear if-then rule.
Optimization is powerful because it forces trade-offs into the open. A manager who wants lower cost must see what quality, capacity, or supplier flexibility that goal consumes. This turns vague disagreement into a quantified choice. The method also has a boundary: the objective and constraints reflect choices made by people, not truths discovered by mathematics. A perfectly solved model can still encode a poor target or omit a consequence that matters to customers.
Price risk by testing many plausible futures, not one forecast
Inputs are uncertain. Supplier specifications, demand, and shipping conditions may vary. The book shows how to represent uncertain measurements with distributions, then draw many possible scenarios using Monte Carlo simulation. In the orange-juice example, each scenario samples plausible flavor and color values from supplier averages and standard deviations. The optimization is then required to satisfy quality limits across those scenarios, rather than only under idealized average conditions.
Measure the trade-off. When a cost target cannot be met without relaxing quality requirements, the model can minimize that relaxation. A minimax version limits the worst degradation instead of hiding a severe weakness inside a reassuring average. This approach makes risk visible: decision-makers can compare cost with the robustness of the resulting blend, rather than treating uncertain inputs as fixed facts.
What's valuable here is the shift from asking for the single best plan to asking how a plan behaves across a range of plausible conditions. That is a more honest basis for operational decisions when averages conceal exposure. The scenario method is only as credible as its distributions and assumptions, however. One hundred simulated cases do not represent every possible disruption. Scenario coverage, probability estimates, and the cost of failure deserve explicit scrutiny.
Engineer useful signals, then judge predictions on untouched cases
Features carry the signal. To identify pregnant households, RetailMart combines purchase indicators such as pregnancy tests, prenatal vitamins, folic acid, and maternity clothes. No single purchase proves pregnancy. The model looks for a pattern across imperfect clues. Categorical information, such as gender or address type, must first be converted into numerical indicator columns, a process called dummy coding. The example assumes 6 percent of customers are pregnant, but balances the training sample to avoid a model that can appear accurate by predicting “not pregnant” for nearly everyone.
Test beyond training. A regression learns coefficients from labeled examples, then scores customers it did not train on. The model’s threshold determines how many are classified as pregnant. Raising it typically reduces false alarms while also missing more true cases. Precision, specificity, recall, and a receiver operating characteristic curve help reveal these trade-offs.
The chapter’s strongest practical point is that modeling begins with the construction of the evidence, not the choice of algorithm. A better feature or cleaner label can matter more than a more elaborate model. The separate test set also guards against the tempting mistake of congratulating a model for remembering its training examples. In practice, thresholds should reflect the cost of each error, and sensitive inferences about people require more than statistical usefulness.
Combine weak rules when one clever model misses the pattern
Small rules can add up. A decision stump is a simple classifier based on one question, such as whether a household bought folic acid. It misses many cases, but ensemble methods combine many such rules. Bagging trains models on different random samples of the data and lets them vote. Boosting trains successive models that focus more on cases earlier models classified incorrectly.
The example shows different strengths. With 200 stumps, the bagged model identified about 33 percent of pregnant households at a 1 percent false-positive rate. The boosted model reached about 85 percent recall with a 27 percent false-positive rate. These figures come from the book’s illustrative dataset and do not imply that boosting always wins. Bagging is easier to parallelize and can resist overfitting; boosting may be more accurate but can chase noisy examples.
Ensembles illustrate a general modeling principle: diversity among imperfect components can be more useful than repeating one method. Bagging creates diversity through resampling; boosting creates it by redirecting attention toward previous errors. The comparison also shows why a single accuracy number is inadequate. One operating point may suit a low-cost marketing offer, while another is unacceptable for a high-stakes decision. The right ensemble is inseparable from the consequences of its mistakes.
Forecast level, trend, and seasonality, then show uncertainty
Match the model to the pattern. Exponential smoothing gives greater weight to recent observations. Simple exponential smoothing tracks a changing level; Holt’s method adds a trend; Holt-Winters adds recurring seasonality. In the sword-sales example, three years of monthly data show growth and a December surge. Checking the forecast errors for autocorrelation helps reveal whether a repeated pattern remains unexplained. A 12-month signal supports adding seasonality to the model.
A point forecast is incomplete. The book generates future error scenarios using the estimated standard error, then uses percentiles to form prediction intervals. For the first forecast month, the estimate is about 245 swords, while the 95 percent interval runs roughly from 224 to 264. The interval widens further into the future, communicating that uncertainty compounds with time.
Forecasting is presented as disciplined uncertainty, not clairvoyance. The sequence of level, trend, and seasonality gives analysts a practical way to explain what the model is tracking, while error checks can expose missing structure. Prediction intervals matter because planning against one number invites false precision. Their reliability still depends on assumptions about past errors continuing into the future. A structural break can make a carefully calculated interval misleading.
Look for outliers in context, not only at the extremes
Extremes are only one kind. Tukey fences flag unusually high or low values using quartiles and the interquartile range. They work well as a quick screen for roughly bell-shaped, one-dimensional data. The story of Mrs. Hadlum, whose pregnancy reportedly lasted 349 days against an average of about 266, shows how an extreme value can provoke questions without settling them. But some anomalies sit between groups rather than at the edge, like a dwarf among hobbits and tall people.
Neighbors reveal local oddness. For multidimensional employee data, the book standardizes measures, computes distances, and compares each person with nearby colleagues. Local outlier factors assess whether a person is unusually distant from their neighbors relative to how distant those neighbors are from theirs. In the call-center example, this highlights both an unusually strong employee and a possible underperformer who was not extreme on any single measure.
The move from fences to neighborhood comparisons changes the question from “Is this value large?” to “Does this observation fit its surroundings?” That distinction matters in fraud, quality control, and workforce analysis, where unusual combinations can be more informative than spectacular single values. Yet an outlier score is not an explanation or accusation. A strong anomaly detector should lead to contextual review, because legitimate specialists and data errors can both look unlike the crowd.
Prototype in spreadsheets, automate in R, and translate for operators
Tools should follow the work. Spreadsheets make it possible to inspect calculations while learning clustering, regression, forecasting, and optimization. Once the method is understood, R packages can automate much of the same work. The book demonstrates that a few R functions can cluster wine customers, fit pregnancy classifiers, forecast sword demand, and detect call-center outliers. This is a move from manually recreating every step toward using tested implementations.
People complete the analysis. A useful model depends on the business understanding its inputs, maintaining its data, and acting on results. The analyst must learn how a process works, check whether the question is framed correctly, and explain the result in terms colleagues can use. A technically elegant model that nobody can maintain or trust is not a successful business solution.
The progression from spreadsheet to code is not a contest between old and new tools. It is a progression from visibility to repeatability. Spreadsheets expose assumptions; programming reduces manual repetition and supports scale. The essential skill is knowing what must remain inspectable when automation begins. The book’s emphasis on translation is especially consequential: analysts gain influence not by protecting technical mystique, but by helping colleagues understand what a result can and cannot support.
Analysis
Data Smart is best understood as a practical field guide to analytical judgment, not merely a primer on algorithms. Its examples range from a wine seller trying to segment customers to an orange-juice company balancing cost and taste, a retailer inferring pregnancy from purchases, and a call center seeking unusual employee profiles. The recurring message is that method selection, data representation, and business purpose are inseparable. A distance metric determines what counts as a similar customer; an objective function determines which trade-offs an optimizer rewards; a threshold determines which errors a classifier tolerates.
The book’s most effective teaching choice is to make sophisticated methods tangible in spreadsheets. Readers can see how a calculation is built, why a modeling choice matters, and where the machinery can fail. The same accessibility has a cost: spreadsheet implementations can obscure numerical and statistical subtleties, and hand-building a method is not equivalent to validating it for deployment. The R chapter signals a necessary transition from learning algorithms to using reliable software implementations.
The examples also reveal a useful hierarchy of analytical work. First understand the decision and the process. Then represent the data so it captures relevant distinctions. Next choose a method and test its behavior. Finally explain the consequences to people who can act. This is stronger than a tool-first view of data science, but it also invites caution. Predictive accuracy does not establish causation, and a pattern in transaction data does not automatically justify intervening in someone's life. Models inherit the limits of labels, features, samples, and institutional choices.
The durable contribution is therefore not any single algorithm. It is a working habit of asking what the data means, what the model optimizes, what uncertainty remains, and who must use the answer. That discipline makes both simple and advanced methods more useful, and less likely to become expensive theater.
Review Summary
Data Smart receives overwhelmingly positive reviews for its approachable introduction to data science using Excel. Readers praise Foreman's clear explanations, practical examples, and engaging writing style. The book covers various data analysis techniques, from clustering to forecasting, making complex concepts accessible to beginners. Many appreciate the hands-on approach with Excel before transitioning to R. While some found certain sections challenging, most agree it's an excellent resource for those looking to enter the field of data science or enhance their analytical skills.
People Also Read







Glossary
k-means clustering
Groups observations around centersAn unsupervised method that assigns each observation to its nearest cluster center, then adjusts the centers to reduce within-cluster distances. The number of clusters, k, must be chosen in advance. Results depend on the features and distance measure used, so the resulting groups require interpretation rather than automatic acceptance.
Silhouette
Scores cluster separationA cluster-quality measure comparing an observation's average distance to members of its assigned cluster with its average distance to the nearest alternative cluster. Scores near 1 indicate a clearer assignment, values near 0 indicate overlap, and negative values suggest the observation may fit another cluster better. Average scores can help compare different values of k.
k-medians clustering
Uses observed cluster centersA variation on k-means in which cluster centers are constrained to values represented in the observations, rather than being averages that may create fractional features. For binary purchase data, the book pairs this approach with an asymmetric measure of similarity so that shared purchases matter more than shared non-purchases.
Cosine distance
Measures purchase-pattern differenceA distance for comparing vectors based on the angle between them. For binary purchase records, cosine similarity reflects overlap in purchases adjusted for how many purchases each customer made; cosine distance is one minus that similarity. It is useful for sparse transactional data when matching positive actions matters more than matching absences.
Naïve Bayes
Classifies from conditional word countsA probabilistic classifier that estimates how likely observed features are within each class, then selects the class with the stronger resulting score. In text classification, it commonly treats a document as an unordered collection of words and assumes those words are conditionally independent given the class. Additive smoothing handles unseen words, and log probabilities keep products numerically manageable.
Big M constraint
Links binary choices to quantitiesA linear-programming technique for representing conditional logic with a binary decision and a sufficiently large bound. For example, an indicator can be forced to 1 when a supplier quantity is positive, while a zero indicator forces that quantity to zero. The bound must be large enough to permit every legitimate quantity, but not needlessly huge.
Graph modularity
Scores community assignmentsA network measure that rewards grouping connected nodes and penalizes groupings that could be explained by chance connections. The expected connection count is estimated from node degrees and the total number of edges or stubs. Maximizing modularity provides a way to identify communities without choosing a fixed number of groups in advance.
Local outlier factor
Ranks local unusualnessAn outlier score based on comparing a point's local density with the density of its nearest neighbors. A score around 1 suggests the point is broadly similar to its neighborhood; a larger score indicates it is less locally typical. Unlike a simple distance threshold, the method can identify an observation that is unusual relative to nearby points even when it is not globally extreme.
Multiplicative Holt-Winters Exponential Smoothing
Forecasts level, trend, and seasonalityAn exponential-smoothing forecasting method that updates estimates of a time series' level, trend, and repeating seasonal factors. The seasonal effect multiplies the underlying level-and-trend forecast, making the method useful when seasonal swings grow or shrink along with the series. Smoothing parameters control how strongly recent forecast errors update these estimates.
Bagging
Combines models trained on samplesAn ensemble method that trains multiple predictors on different random samples of the training data, then combines their predictions, often by voting. The sample variation produces a collection of models rather than repeated copies of one model. Bagging can reduce sensitivity to individual training examples and its separate model fits can be performed in parallel.
FAQ
What is [Data Smart: Using Data Science to Transform Information into Insight] by John W. Foreman about?
- Comprehensive data science guide: The book introduces a wide range of data science techniques, from classic operations research (optimization, forecasting, simulation) to modern machine learning (clustering, outlier detection, regression, ensemble models).
- Business-focused applications: It emphasizes practical, real-world business problems, showing how to turn raw data into actionable insights for managers, analysts, and marketers.
- Hands-on learning: Readers are taught to implement methods in Excel first, then transition to R for more advanced analytics, ensuring conceptual understanding before coding.
- Conceptual clarity over tools: The author stresses understanding the underlying math and logic behind techniques, not just using software blindly.
Why should I read [Data Smart] by John W. Foreman?
- Bridges theory and practice: The book demystifies data science, making complex concepts accessible through step-by-step Excel examples before moving to programming.
- Business impact focus: It teaches readers how to identify, frame, and solve real business problems using data science, avoiding unnecessary technical complexity.
- Accessible to non-programmers: No advanced programming skills are required initially; the book is ideal for those with basic math and spreadsheet experience.
- Prepares for advanced analytics: By the end, readers are ready to use R and other tools for scalable, real-world data science projects.
What are the key takeaways from [Data Smart] by John W. Foreman?
- Understand before automating: Mastering the logic and math behind data science techniques is more important than relying on tools or code.
- Excel as a learning platform: Spreadsheets are powerful for prototyping, visualizing, and understanding analytics before scaling up.
- Diverse techniques covered: The book covers clustering, regression, optimization, forecasting, outlier detection, and ensemble models, providing a broad foundation.
- Communication and creativity matter: Effective data science requires not just technical skills, but also problem framing, communication, and integration into business processes.
What foundational spreadsheet and Excel skills does [Data Smart] by John W. Foreman teach?
- Essential Excel operations: The book covers formula referencing, conditional formatting, data filtering, sorting, and using PivotTables for aggregation.
- Advanced formulas: Key functions like VLOOKUP, MATCH, INDEX, OFFSET, SMALL/LARGE, and array formulas are explained for data manipulation and analysis.
- Data visualization: Readers learn to create charts and use conditional formatting to explore and summarize data visually.
- Prototyping analytics: Excel is used to build and test data science models before moving to programming languages.
How does [Data Smart] by John W. Foreman explain clustering, especially k-means and k-medians?
- Intuitive analogies: The book uses relatable examples, like a middle school dance, to explain how k-means clustering assigns data points to the nearest cluster center.
- Business applications: Clustering is applied to segment customers based on purchase data, using distance metrics like Euclidean and cosine similarity.
- Limitations and improvements: Challenges with sparse or binary data are discussed, and k-medians clustering with cosine similarity is introduced for better segmentation.
- Cluster evaluation: The silhouette score is used to assess cluster quality and determine the optimal number of clusters.
What is the silhouette score and how is it used in [Data Smart] by John W. Foreman?
- Cluster quality metric: The silhouette score measures how well a data point fits within its assigned cluster compared to other clusters, ranging from -1 to 1.
- Calculation explained: It is computed as the difference between the average distance to the nearest neighboring cluster and the average distance to the own cluster, divided by the maximum of the two.
- Choosing the right k: Silhouette scores help select the optimal number of clusters by comparing results across different k values.
- Practical application: The book demonstrates using silhouette analysis in Excel to guide business segmentation decisions.
How does [Data Smart] by John W. Foreman teach supervised AI models like Naïve Bayes and regression?
- Naïve Bayes classification: The book introduces Naïve Bayes for document classification, explaining conditional probability, Bayes Rule, and the independence assumption.
- Excel implementation: Readers learn to tokenize text, calculate probabilities with smoothing, and classify new documents using Excel formulas.
- Linear and logistic regression: The book covers building regression models from scratch, estimating coefficients, and evaluating model fit with R-squared, F tests, and t tests.
- Model performance: Techniques for assessing precision, recall, specificity, and ROC curves are explained for both regression and classification tasks.
How are ensemble models like bagging and boosting explained in [Data Smart] by John W. Foreman?
- Bagging with decision stumps: The book shows how to create multiple simple classifiers on random data subsets and combine their votes for improved accuracy.
- Boosting concept: Boosting is explained as an iterative process where each new model focuses on correcting previous errors by reweighting data.
- Excel automation: Readers learn to use macros to efficiently build and evaluate large ensembles in Excel.
- Performance evaluation: The book demonstrates how to compare bagging and boosting using ROC curves and discusses their strengths and limitations.
What optimization modeling concepts and tools are taught in [Data Smart] by John W. Foreman?
- Linear programming basics: The book explains how to formulate business problems with objectives, decision variables, and linear constraints, using examples like the guns and butter problem.
- Advanced modeling: Integer and binary variables, "Big M" constraints for conditional logic, and linearization of non-linear relationships are covered.
- Handling uncertainty: Techniques like Monte Carlo simulation and robust optimization are introduced to model risk and variability in input data.
- Practical tools: OpenSolver is recommended for solving large optimization problems in Excel.
How does [Data Smart] by John W. Foreman approach network graphs and community detection?
- Network graph fundamentals: Nodes represent entities and edges represent relationships, with graphs constructed from data using adjacency and similarity matrices.
- Community detection: The book explains modularity maximization as a way to find communities, using both linear optimization and tools like Gephi.
- Graph pruning: Techniques like r-neighborhood and k-nearest neighbor graphs are used to simplify and analyze network structure.
- Visualization and analysis: Readers learn to export data to Gephi for visualization and interpret modularity scores for business insights.
What forecasting methods are covered in [Data Smart] by John W. Foreman and how are they implemented?
- Exponential smoothing: The book covers simple, Holt’s trend-corrected, and Holt-Winters multiplicative exponential smoothing for time series forecasting.
- Parameter optimization: Readers learn to optimize smoothing constants and test for trend and seasonality using statistical methods.
- Forecast evaluation: Residual autocorrelations are checked with correlograms, and prediction intervals are created using Monte Carlo simulation.
- Visualization: Fan charts are used to display forecast uncertainty and communicate results effectively.
How does [Data Smart] by John W. Foreman teach outlier detection in data science?
- Univariate methods: Tukey fences are used to detect outliers in normally distributed data based on quartiles and interquartile range.
- Multidimensional challenges: The book discusses the limitations of simple methods and introduces graph-based techniques for complex data.
- Graph-based detection: Methods like k-nearest neighbor graphs, indegree, k-distance, and local outlier factors (LOF) are explained for identifying global and local outliers.
- Practical application: Readers learn to implement these methods in Excel and R, applying them to real-world datasets for fraud detection and data quality analysis.
How does [Data Smart] by John W. Foreman guide the transition from Excel to R for data science?
- R basics introduction: The book covers R’s console, variable assignment, vectors, matrices, and dataframes for data manipulation.
- Data preparation: Readers learn to import CSV files, handle missing values, and factor categorical variables in R.
- Using R packages: Key packages for clustering, regression, forecasting, and outlier detection are introduced, with examples replicating Excel analyses.
- Encouragement for further learning: The author emphasizes that understanding algorithms enables effective use of advanced tools and points to resources for deeper R mastery.
Download PDF
Download EPUB
.epub digital book format is ideal for reading ebooks on phones, tablets, and e-readers.








