

Key Takeaways
Estimate roughly first; refine only when the decision depends on precision.
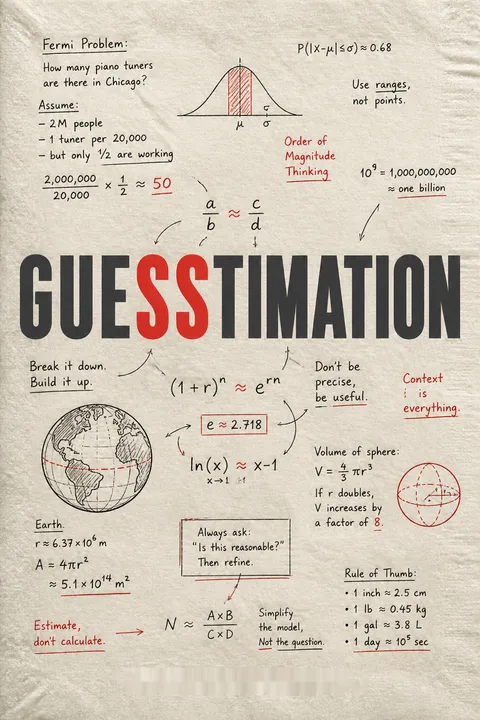
Start with a usable answer. The book’s central skill is guesstimation: making a defensible estimate from a few familiar facts, often accurate within a factor of ten. That roughness is useful. It can tell whether a trip is practical or whether an expense is obviously too high, without pretending to know the exact answer.
Break the puzzle apart. When a question resists an immediate estimate, divide it into smaller quantities, bound each one, and combine them. To estimate piano tuners in Los Angeles, for example, estimate the city’s population, how many pianos it contains, how often each piano is tuned, and how many jobs one tuner can do. Enrico Fermi was famous for this style of reasoning. The authors repeat the story that he estimated an atomic blast from scraps of paper moved by its shock wave.
The method treats estimation as a practical decision tool, not a contest in exact arithmetic. That distinction matters in business, engineering, and public debate, where the first question is often whether a number is plausible enough to act on. Breaking a problem into pieces also makes assumptions visible and revisable. The caution is that a factor-of-ten answer cannot settle every question: it may be enough to reject an implausible purchase, but not to set a safety threshold or allocate a public budget.
Track powers of ten, units, and meaningful digits before trusting an answer.
Size matters most. Scientific notation writes a number as a coefficient multiplied by a power of ten. In an estimate, the exponent usually matters more than the coefficient: confusing millions with billions is far worse than being off by 30 percent. For instance, multiplying 3 trillion by 20 quadrillion becomes 3 × 10¹² times 2 × 10¹⁶, or 6 × 10²⁸, without counting dozens of zeros.
Precision has limits. The book recommends keeping roughly one meaningful digit when the inputs are rough. A calculator might report mileage as 14.2173913 miles per gallon from 327 miles and 23 gallons of fuel, but those measurements do not justify all those digits. Units also act as error checks: converting miles per hour to meters per second or liters to cubic meters helps keep a calculation coherent.
This is a lesson in measurement discipline as much as arithmetic. Extra decimal places can create an illusion of certainty, while unit mismatches can reveal that a calculation is wrong before anyone debates its conclusion. The habit resembles dimensional analysis in physics, where equations must balance not only numerically but also in units. One limitation is that rounding too early can distort calculations involving repeated steps or close comparisons, so the level of precision should fit both the uncertainty in the inputs and the decision at hand.
Split hard questions into quantities you can estimate from lived experience.
Use what is familiar. Many seemingly obscure questions can be answered by translating them into ordinary quantities: trips per year, minutes per task, items per square meter, or the time one worker can spend on a job. The authors estimate how many people are airborne over the United States by asking what fraction of a year the average person spends flying. If people collectively spend about nine hours per year in flight, the same fraction of the population is airborne at a typical moment, roughly 300,000 people.
Look for a useful proxy. To estimate a piano’s tuning time, count its 88 keys and imagine spending a minute or two on each. To estimate household trash, begin with how often a kitchen bin is emptied and how much it holds. A proxy need not be perfect; it must be relevant enough to constrain the answer.
Everyday experience supplies more quantitative information than it first appears to. The flight estimate uses a general accounting principle: when events are distributed across a large population, the share of people engaged in an activity at one moment approximates the share of time each person spends doing it. Such reasoning can turn an invisible aggregate into an intuitive calculation. Its weakness is representativeness. Frequent travelers, unusual work schedules, and seasonal patterns can make one person’s experience a poor stand-in for a whole population.
Use a second route to test whether your estimate deserves belief.
Triangulate the answer. The authors estimate annual American airline flights in two ways. Starting with about 300 million people and roughly three flights per person gives close to 900 million flights. Starting with airports, their flight capacity, and passengers per plane gives about 500 million. Both estimates land near the reported 2005 figure of 660 million domestic passengers.
Compare, do not worship, the result. A mismatch between independent approaches is a warning to inspect assumptions, not a reason to hide the calculation. The book also encourages upper and lower bounds. If a quantity must lie between 1 and 100, the geometric mean, about 10, sits equally far from the two bounds by multiplicative scale. This is more balanced than choosing the arithmetic midpoint of 50.
Independent estimates are valuable because they fail in different ways. A population-based estimate may misjudge average travel, while an airport-based estimate may misjudge capacity or utilization. Agreement does not prove that assumptions are correct, but it makes a large hidden error less likely. This is close to triangulation in social science and measurement: confidence grows when distinct methods converge. The geometric mean is especially useful when uncertainty is multiplicative, although it is not automatically the right midpoint for every kind of uncertain quantity.
Translate huge numbers into places, objects, and consequences people can picture.
Make scale visible. Six billion people packed at about six people per square meter would occupy roughly 1,000 square kilometers, an area comparable to a large city. Give each three-person family a modest house and yard, however, and the total grows to about two million square kilometers, still around 1 percent of Earth’s surface. The same head count produces very different answers depending on what “space for people” means.
Choose a comparison carefully. A billion golf balls would stretch around Earth’s equator, which gives the abstract idea of a billion a physical image. The authors use this comparison to explain parts per billion: a few differently colored balls among a billion would be sparse indeed. Such analogies help readers grasp magnitude, but the comparison must preserve the relevant unit and scale.
A well-chosen analogy converts numerical literacy into intuition. It also exposes how definitions shape results: people standing shoulder to shoulder and families with yards are not competing answers to the same practical question. They describe different assumptions. This is why public statistics need both a number and a clear account of what it measures. Analogies can mislead when they make unlike things seem interchangeable, so a vivid comparison should illuminate the scale without replacing the underlying calculation.
Count the energy and time hidden inside ordinary transportation choices.
A car consumes more than fuel money. The authors estimate a typical car’s lifetime at about 100,000 miles and its fuel economy at 20 miles per gallon. That implies roughly 5,000 gallons of gasoline, around 20 cubic meters or 20 tons of fuel, about ten times the mass of the car itself.
Include the time behind the wheel. A car costing about $60,000 over 120,000 miles requires around 3,000 hours of work at an estimated $20 per hour. Driving those miles at an average of 40 miles per hour also takes about 3,000 hours. Counting both the driving and the work needed to pay for it produces an effective travel speed near 20 miles per hour, before parking or repairs.
This accounting reframes transportation as a bundle of material and human costs. The fuel mass is easy to overlook because it disappears through the exhaust, while the time cost is hidden in a paycheck rather than displayed on a dashboard. The exercise is useful for comparing options, but its result depends heavily on assumptions about car price, repair costs, wages, mileage, and driving speed. It is not a universal verdict on car ownership; it is a prompt to include costs that ordinary comparisons leave out.
Compare energy sources by storage, conversion, and delivery, not slogans.
Energy is not equally portable. Gasoline stores about 50 times more chemical energy per kilogram than an alkaline D-cell battery. To store the energy in a 20-gallon gas tank, the book estimates that the best rechargeable batteries available in 2006 would weigh about three tons. Adjusting for the waste heat of a gasoline engine reduces the comparison to roughly one ton of batteries, still a major burden for a car.
Delivery matters too. Pumping gas transfers energy at an estimated rate around 10 megawatts. A household’s dedicated electric charging circuit might provide around 10 kilowatts, roughly a thousand times slower. These comparisons help explain why replacing a fuel source involves more than matching total energy: storage mass, conversion losses, infrastructure, and refueling time all matter.
The useful insight is systems thinking: an energy source must be judged from storage to useful work, not by a single headline number. Energy density favors liquid fuels, while electric drivetrains avoid some conversion losses; charging speed and storage weight introduce different constraints. The book’s battery figures describe technology available at publication, so they should not be treated as current specifications. More broadly, comparisons need a consistent boundary, since fuel energy, delivered electricity, and motion at the wheels are distinct quantities.
Put frightening risks beside their denominator before deciding what to fear.
Ask “per what?” The authors estimate about two road deaths per 100 million miles driven in the United States, and a lifetime chance of roughly 1 percent of dying in a car crash. Their estimate for large-plane travel is nearly a thousand times safer per mile, though many plane accidents happen during takeoff and landing, so a per-mile comparison does not describe every flight equally well.
Compare the whole exposure. Shark deaths attract intense attention, but the book estimates that driving to the beach causes far more deaths than shark attacks. It also estimates that a heavy smoker may lose about five minutes of life per cigarette, while citing a study’s estimate of 11 minutes. The authors caution that assigning equal harm to every cigarette is a crude assumption.
Risk perception is shaped by vividness, not just frequency. A shark attack is memorable; routine driving is not, even when the cumulative exposure is larger. Denominators help correct that imbalance, but the choice of denominator matters: per mile, per trip, per person, and per lifetime answer different questions. The cigarette example adds another useful caution. A population average can describe a broad association without proving that each individual exposure subtracts an identical amount of life.
Analysis
The book’s deeper subject is not estimation alone. It is how to reason responsibly when exact data are unavailable, costly, or beside the point. Its recurring move is to translate a question into quantities with familiar units, state assumptions, and check whether the answer survives comparison with another route. The method makes numerical claims inspectable. Readers can see which assumptions drive an estimate and replace them with better local knowledge.
That process also turns quantitative literacy into a form of civic skepticism. A claim about doubled danger, vast waste, or abundant energy is hard to assess without asking for its denominator, its time span, and its physical scale. The book’s playful examples matter because they lower the social barrier to doing that arithmetic. A pickle chain or a planet made of gerbils makes calculation feel like curiosity rather than a test. The strongest feature is its insistence that roughness can be honest. A rounded estimate with visible uncertainty is often more informative than a precise-looking figure built from shaky inputs. Yet the factor-of-ten target has clear limits. Estimates that are adequate for deciding whether an object is city-sized may be unacceptable for engineering tolerances, medical dosing, or public safety. Further, several assumptions can be correlated: choosing a high population and a high per-person rate can compound in the same direction, making agreement between calculations less reassuring than it appears.
The best use of the book is therefore as a first-pass reasoning practice, not a substitute for measurement. Its questions train a reader to ask what must be known, what can be bounded, and which details could change the decision. The lasting habit is not memorizing any answer. It is learning to make the structure of an answer visible, then knowing when the rough sketch is enough and when the stakes demand better evidence.
Review Summary
Guesstimation receives mixed reviews, with ratings ranging from 1 to 5 stars. Readers appreciate its approach to problem-solving and estimation skills, finding it useful for interviews and general knowledge. Some enjoy the book's humor and interesting examples. However, critics find it repetitive, overly simplistic, and Americentric. Many readers struggle with the math and find some problems confusing or irrelevant. Overall, the book is praised for teaching estimation techniques but criticized for its narrow focus and occasionally unclear explanations.
People Also Read









Glossary
Fermi problems
rough, structured estimatesFermi problems are questions whose answers can be estimated by breaking them into smaller quantities and using approximate, accessible information. Named for physicist Enrico Fermi, they do not require a single exact solution. Their purpose is to test whether a reasoned estimate is plausible and useful, often before more precise research is warranted.
scientific notation
powers-of-ten number writingScientific notation expresses a number as a coefficient multiplied by a power of ten, such as 3 × 10⁸ for 300 million. The exponent makes the order of magnitude explicit, reducing mistakes when handling many zeros. In estimation, the exponent often matters more than small changes to the coefficient.
significant figures
digits justified by measurementSignificant figures are the digits in a number that reflect how precisely the underlying quantity is known. If distance and fuel use are measured only approximately, a calculator’s long decimal result does not become genuinely precise. The book generally keeps one meaningful coefficient digit because rough inputs cannot support many more.
geometric mean
multiplicative midpointThe geometric mean of two positive numbers is the square root of their product. It provides a midpoint suited to multiplicative uncertainty: the estimate is the same factor above the lower bound as it is below the upper bound. For example, the geometric mean of 1 and 100 is 10, not the arithmetic midpoint of 50.5.
energy density
energy stored per massEnergy density describes how much energy a material stores relative to its mass, commonly measured in joules per kilogram. It allows comparisons between fuels and batteries, while reminding readers that stored energy is not the same as useful output. Conversion efficiency, storage volume, weight, safety, and delivery rate also affect a technology’s practical value.
parts per billion
one part in a billionParts per billion, abbreviated ppb, expresses a very small proportion: one unit of a substance among one billion units of the whole. The book makes the scale tangible by imagining a few differently colored golf balls among a billion balls arranged around Earth. The analogy emphasizes rarity, but the meaning depends on what is being counted.
About the Author
Other books by Lawrence Weinstein

Download PDF
Download EPUB
.epub digital book format is ideal for reading ebooks on phones, tablets, and e-readers.








