

Key Takeaways
Make data scientists business partners, not a black-box service.
Own the question. A bank lost billions after a quantitative analyst warned that many mortgages might not be repaid. The analyst’s model never reached the business leader in useful terms, and the leader did not know the work was underway. Data expertise cannot improve a decision if managers cannot understand its purpose or limits. Managers need not become statisticians, but they should know enough to frame the business problem, assess the assumptions, and decide what action the evidence supports.
Stay involved at both ends. Managers are especially valuable when defining the problem and explaining what the results mean to colleagues. Ask where the data came from, whether it represents the people or events at issue, how outliers were handled, and what could make the model fail. A strong partnership lets experts challenge business intuition and lets business knowledge improve the analysis.
What's striking is that analytical literacy is presented as a management responsibility, not a technical credential. This resembles good medical practice: a patient need not perform surgery, but should understand the diagnosis, alternatives, and risks well enough to consent. The same boundary applies at work. Analysts should own methodological rigor, while leaders own the decision context. That partnership can fail in either direction: executives may dismiss hard-to-read evidence, while specialists may mistake a statistically elegant answer for a relevant one. Shared language is not decoration. It is part of the control system.
Measure the outcome that matters, not the number easiest to celebrate.
Start with the decision. DoSomething.org once posted a video that drew 1.5 million views, about twice the reach of its previous best. Yet only eight viewers signed up to donate used sports equipment, and nobody donated. Views described attention, not social impact. A metric is a chosen measure of success; data is the broader material from which measures are made. Organizations often mistake a visible count for progress because it is easy to collect and looks impressive in a report.
Trace the causal chain. Define the ultimate objective, identify intermediate outcomes that plausibly drive it, then choose measures employees can influence. A retail bank might test whether customer satisfaction predicts use of services, then identify employee-controlled drivers of satisfaction. Revisit metrics as customers and markets change. Reports deserve the same scrutiny: one consumer-products company replaced an enormous monthly review with quarterly, exception-focused reporting and continued operating effectively.
The video example exposes a measurement problem with a human face: a large audience can coexist with no completed action. This is closely related to Goodhart's law, the idea that a measure can stop being useful once it becomes the target people optimize. The corrective is not to reject metrics, but to connect them to a meaningful outcome and test that link. Still, some valuable effects, such as trust or long-term reputation, resist quick measurement. A disciplined scorecard should acknowledge those limits rather than pretend every important result arrives in a weekly dashboard.
Run a controlled test before turning a plausible story into policy.
Make the question testable. A business experiment compares an intervention with a control condition to estimate whether the intervention changes an outcome. Instead of asking whether advertising works in general, a company can test whether a specific brand-name search campaign changes monthly sales. Researchers found that eBay's longstanding brand advertising on Google did not increase visits from paying customers, challenging an apparently sensible practice.
Protect the comparison. Randomly assign comparable participants, define the population and outcomes in advance, and set the duration and sample plan before results arrive. Change one factor or use a design that can identify interactions. Measure intended results and possible side effects. Do not stop a test when the numbers happen to favor a preferred answer. A large, visible intervention can help distinguish a genuinely ineffective idea from one customers barely noticed. Report mixed findings, then refine and test again.
Experiments turn disagreement into a shared procedure: instead of arguing whose intuition is better, participants agree on what evidence would change their minds. Random assignment is powerful because it helps separate an intervention's effect from differences that already existed between groups. Yet experiments do not automatically settle every question. Results may not transfer to another customer group, season, or market, and some interventions carry ethical or reputational costs. The most useful experiment is therefore not merely rigorous. It is also narrow enough to interpret and consequential enough to justify the disruption.
Audit data before trusting the precision of its analysis.
Trace its origins. A polished chart cannot repair data recorded incorrectly, defined inconsistently, or drawn from the wrong population. Ask who created the data, how its fields were defined, and what checks were performed. A practical first audit is to inspect a small sample of records across important fields, such as customer, item, and price. Mark obvious errors and look for patterns. If errors cluster in one field, that field may be unusable even when the rest looks sound.
Clean with restraint. Correct errors that can be verified, mark uncertain values, and remove records that cannot be repaired. Then check a cleaned sample before applying automated fixes to the rest. When joining data sets, align people and units, reconcile definitions, and remove duplicate records. Imperfect data can still be useful, but the decision should reflect its weaknesses. A high-stakes investment requires more confidence than a low-cost exploratory test.
Data quality is often treated as plumbing, but it is closer to instrument calibration in science. A thermometer can produce precise decimals and still be wrong if it was miscalibrated. Sampling a manageable set of records makes quality visible before a large analysis gives errors the appearance of authority. The caution is that cleaning also involves judgment: aggressive correction can erase genuine unusual cases. A defensible workflow preserves the original records, documents changes, and distinguishes verified corrections from estimates. Trust should be earned field by field, not granted to a data set as a whole.
Treat every model as a conditional forecast, not an oracle.
Read the model's conditions. Regression analysis estimates how an outcome, called the dependent variable, changes alongside one or more explanatory variables. A sales model might relate monthly sales to rainfall, promotions, and other factors. Predictive analytics uses relationships found in past data to estimate future outcomes, such as which customers may buy next. These estimates depend on data quality, appropriate variables, and the assumption that relevant patterns persist.
Match the tool to the task. Machine learning uses statistical methods to detect predictive patterns in data. It can help with prediction when the problem is bounded and the available data captures the important conditions. It cannot, by itself, explain causes or supply knowledge missing from the data. In one pneumonia prediction example, an algorithm recommended sending asthma patients home because the data failed to account for their intensive care. Ask what the model learned, what it cannot know, and how costly its errors would be.
A model is best understood as a compressed description of a particular world, not a miniature copy of reality. Its usefulness depends on whether that world resembles the one in which a decision is made. This distinction matters especially when a model guides treatment, credit, hiring, or safety: prediction can reproduce patterns created by prior policies, including unequal treatment. The practical standard is not simply accuracy on historical data. It is performance under current conditions, with error costs examined across affected groups. A forecast should invite monitoring, not end inquiry.
Act on correlations only when confidence and downside justify it.
Separate association from cause. Correlation means two measures vary together; it does not establish that one produces the other. Regression can reveal a relationship, but a plausible mechanism or experiment is needed to support a causal claim. Whether a correlation is actionable depends on how reliably it recurs and what happens if the response is wrong. New York City could inspect a location flagged by sewer-grease sensors because an unnecessary inspection costs little. Prostate screening, by contrast, can lead to harmful treatment after a false positive, so weak predictive evidence carries greater risk.
Distinguish real from useful. Statistical significance estimates how compatible a result is with chance under a statistical test. Practical significance asks whether the size of the result matters for the decision. A tiny difference may be statistically significant with enough observations yet not justify a costly change. Consider uncertainty, implementation cost, and the consequences of false positives and false negatives before acting.
This is decision theory in managerial clothing: evidence matters, but so does the loss attached to each possible mistake. The same correlation can justify a cheap probe and fail to justify a high-stakes intervention. That framing avoids two extremes, blind faith in large data and paralysis until causation is proven. A further safeguard is to state the decision threshold before seeing results. Otherwise, people can quietly change what counts as convincing after learning which answer they prefer. The right level of proof is proportional to the harm and reversibility of the action.
Draw the curve before trusting your intuition about change.
Expect nonlinear effects. Linear bias is the tendency to assume that a change in one measure produces a proportional change in another. Fuel economy illustrates the trap: over 10,000 miles, improving a vehicle from 10 to 20 miles per gallon reduces fuel use from 1,000 to 500 gallons, saving 500. Improving from 20 to 50 miles per gallon reduces use from 500 to 200 gallons, saving 300. The larger gain in miles per gallon saves less fuel.
Inspect thresholds and diminishing returns. A price cut can increase sales while reducing profit because each sale earns less. Similarly, customer retention can become especially valuable at already-high retention levels, while the first improvements may have smaller effects. Averages can hide these patterns. Plot outcomes across several values, not just two, and ask whether the curve rises, flattens, or changes sharply. Visualizing the relationship often reveals what an intuitive percentage comparison conceals.
The fuel example is memorable because it exposes a mismatch between the unit people notice and the outcome they care about. Miles per gallon sounds like a direct measure of fuel saved, but gallons consumed depend on its reciprocal relationship. This is a broader lesson in dimensional reasoning: before comparing improvements, specify the quantity being optimized. The same habit can improve decisions about pricing, returns, and capacity. Charts help, but only if axes and units are clear. Visual simplicity can itself mislead when a nonlinear process is forced into a straight-line story.
Stress-test conclusions against bias, noise, and inconvenient outliers.
Challenge the preferred story. Confirmation bias favors evidence that agrees with existing beliefs; overconfidence makes decision makers too sure of their judgments; overfitting occurs when a model captures random quirks rather than a pattern that predicts new cases. Google Flu Trends, for example, relied on search terms correlated with flu activity, but some seemingly predictive searches reflected chance rather than a durable signal. Test models on data not used to build them, and specify methods before inspecting results.
Inspect what averages hide. A financial-services call center appeared to have worsening service, but a policy change created unusually long calls for a particular group of newly retired customers. Those calls distorted the overall average. Show results with and without influential outliers, explain how they were treated, and investigate their causes before removing them. Separate evidence from advocacy, and invite independent reviewers to look for explanations that contradict the initial conclusion.
The traps described here are not merely personal weaknesses. Incentives can reward a pleasing result, and standard reporting can bury the subgroup that explains a surprising average. Independent analysis, precommitted methods, and out-of-sample checks create procedural friction against motivated reasoning. Outliers deserve special care because they may be errors, but they may also signal the very event a business needs to understand. Removing them can improve a model's fit while making the real-world decision worse. The aim is not to distrust every result, but to make alternative explanations visible.
Make findings legible, honest about uncertainty, and worth acting on.
Design for the audience. A visualization is useful only when the data is interpretable, relevant to the decision, and capable of adding insight. A clean bar chart may make comparisons easier than a decorative three-dimensional graphic; a presentation needs a clear point, while a report can support more detail. Show uncertainty rather than presenting a forecast as a promise. Probabilities are especially easy to misread: a low-probability outcome can happen without proving that the forecast was faulty.
Give the evidence a story. Gregor Mendel's work on inheritance went largely unrecognized during his lifetime, in part because its findings did not reach the right audience effectively. Numbers need explanation, context, and a proposed action. A useful presentation connects the business problem, the measure of impact, the available evidence, the solution, and what changed. When someone challenges the data, treat the objection as a reason to clarify or collect better evidence, not merely as an attack to defeat.
Communication is not a cosmetic stage added after analysis. It is where evidence enters collective judgment, where assumptions become discussable, and where an organization decides who bears the risk of acting. Narrative helps audiences understand why a result matters, while visual design can make comparisons and uncertainty perceptible. Neither should be used to disguise weak evidence. Good communication pairs a compelling account with visible limitations, alternative explanations, and a concrete decision. That combination earns attention without asking an audience to confuse persuasive presentation with proof.
Analysis
This guide treats analytics less as a specialized technical department than as an organizational capability. Its central argument is that better decisions require a chain of accountability: managers define the problem, analysts make methods and assumptions inspectable, and leaders connect results to action. Failure at any link turns data into decoration. The mortgage-bank anecdote shows a communication failure; the viral video shows a measurement failure; the pneumonia model shows a context failure. Together, these cases make analytics a social process as much as a mathematical one.
The book's most durable contribution is its insistence that evidence must be evaluated relative to a decision. Data quality, statistical significance, causality, and visualization are not independent boxes to tick. They answer different questions. Is the input trustworthy? Is the observed pattern likely to be noise? Does the pattern imply a mechanism? Is the effect large enough to matter? What is the cost of acting incorrectly? This structure usefully resists the common managerial fantasy that more data automatically produces more certainty.
Its practical advice also points toward a governance model. Experiments should have predeclared questions and measures; models should be checked against new data and monitored as conditions shift; metrics should be reviewed when incentives or customers change; and presentations should expose uncertainty and outliers. These practices make analysis auditable and reduce opportunities for cherry-picking. The emphasis on managers as informed consumers is especially important because expertise is distributed: specialists understand methods, while operators understand constraints and consequences.
A limitation is that a manager's intuition is not always a reliable corrective to quantitative evidence. The guide rightly recommends combining judgment with analysis, but organizations should distinguish domain knowledge from confidence rooted in hierarchy or habit. Nor can communication alone fix power imbalances that suppress inconvenient results. The strongest interpretation is therefore not data plus intuition, but disciplined inquiry with diverse expertise, transparent methods, and decision rules proportionate to risk. Analytics earns authority when it remains revisable, not when it claims to be neutral or final.
Review Summary
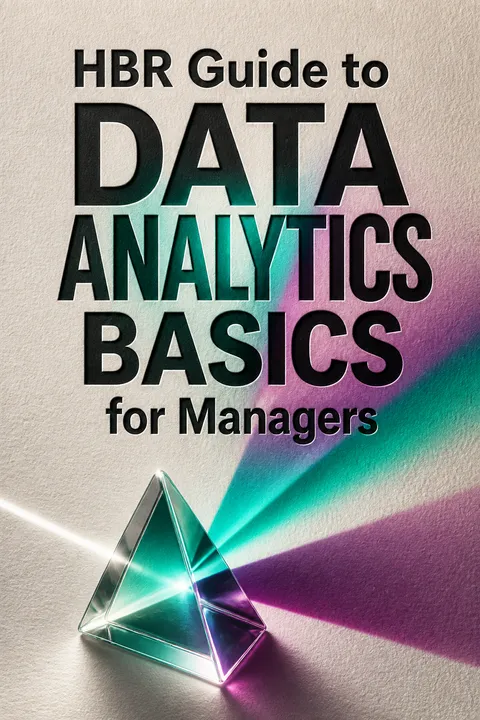
HBR Guide to Data Analytics Basics for Managers receives mixed reviews, with an average rating of 3.90 out of 5. Readers appreciate its comprehensive overview of data analytics concepts, practical examples, and insights for managers. Many find it useful for beginners and as a reference guide. However, some criticize its superficial coverage of topics and lack of cohesion between articles. The book is praised for its clarity, real-world applications, and emphasis on critical thinking in data-driven decision-making. Overall, it's considered a valuable resource for managers seeking to understand data analytics basics.
People Also Read









Glossary
A/B testing
Compares two alternativesAn experimental method that compares two versions of a product, message, or process. Participants are assigned to a control condition and a changed condition, ideally at random, and outcomes are compared using a measure chosen in advance. It is common online, where organizations can test versions with users and reverse a change if it performs poorly.
Predictive analytics
Forecasts from past dataThe use of historical data and statistical models to estimate future outcomes or behaviors. Examples include forecasting sales, estimating customer lifetime value, and predicting which offer a customer may accept. Its accuracy depends on relevant data and on whether the conditions and behavioral patterns represented in the past remain useful for the future.
Regression analysis
Estimates variable relationshipsA statistical method for estimating how an outcome variable relates to one or more explanatory variables. It can help identify which measured factors are associated with an outcome and quantify the estimated relationship. Regression does not, by itself, establish that an explanatory variable causes the outcome, and its results depend on data, model choices, and assumptions.
Statistical significance
Assesses chance compatibilityA statistical judgment about whether an observed result is unlikely under a specified chance-based model, often expressed through a p-value. Statistical significance does not show that an effect is large, commercially important, or causal. Managers should consider effect size, data quality, decision costs, and the practical consequences of acting.
Machine learning
Finds patterns for predictionA family of statistical methods that uses data to identify patterns and generate predictions. These methods can be useful when a problem is sufficiently bounded and the data captures relevant conditions. They cannot supply missing contextual knowledge or automatically establish why a pattern occurs, and their predictions can fail when conditions change.
Linear bias
Assumes proportional changeA tendency to expect that changes in one variable produce proportional changes in another. Many business relationships are nonlinear: effects can accelerate, flatten, or change sharply at thresholds. Linear bias can distort comparisons involving fuel use, pricing, customer retention, and returns. Plotting several values can reveal the shape that intuition misses.
Overfitting
Mistakes noise for patternA modeling failure in which a model captures accidental quirks in the data used to build it rather than a stable relationship. It may explain past observations impressively but predict new cases poorly. Testing against data not used to construct the model helps reveal whether its apparent accuracy generalizes.
Vanity metrics
Impressive but weak indicatorsMeasures that look like signs of success but do not reliably track the outcome an organization values. Website views or social-media followers, for instance, may create impressive totals without showing whether people donated, bought, or stayed. Such measures become useful only when their connection to meaningful outcomes is demonstrated.
FAQ
What's "HBR Guide to Data Analytics Basics for Managers" about?
- Purpose: The book is designed to help managers understand and utilize data analytics to make informed business decisions.
- Audience: It targets managers who may not have a statistical background but need to work with data in their roles.
- Content: It covers the basics of data analytics, including gathering, analyzing, and communicating data insights.
- Structure: The book is divided into sections that guide readers through the data analytics process, from understanding data to making decisions based on it.
Why should I read "HBR Guide to Data Analytics Basics for Managers"?
- Skill Development: It helps managers develop essential data analytics skills, which are increasingly important in today's data-driven business environment.
- Decision Making: The guide provides tools and techniques to improve decision-making processes using data.
- Practical Advice: It offers practical advice and real-world examples to help managers apply data analytics in their daily work.
- Confidence Building: By demystifying data analytics, the book aims to build managers' confidence in using data to support their decisions.
What are the key takeaways of "HBR Guide to Data Analytics Basics for Managers"?
- Data Literacy: Managers need to understand where data comes from and how it can be used effectively.
- Analytical Process: The book outlines a three-step process: gathering data, analyzing it, and communicating findings.
- Avoiding Pitfalls: It highlights common mistakes in data analysis and how to avoid them.
- Collaboration: Emphasizes the importance of working effectively with data scientists and other experts.
What are the best quotes from "HBR Guide to Data Analytics Basics for Managers" and what do they mean?
- "Data is coming into companies at remarkable speed and volume." This highlights the growing importance of data in business and the need for managers to harness it effectively.
- "Never make the mistake of assuming that the results will ‘speak for themselves.’" This emphasizes the importance of communicating data insights clearly to drive action.
- "The goal is not to fi gure out what is going on in the data but to fi gure out what is going on in the world." This quote underscores the need to connect data analysis to real-world business contexts.
How does "HBR Guide to Data Analytics Basics for Managers" suggest managers gather the right data?
- Focused Questions: Start by asking the right questions to guide data collection efforts.
- Data Sources: Identify both internal and external data sources that can provide relevant information.
- Data Quality: Assess the quality of data to ensure it is reliable and trustworthy.
- Collaboration: Work with data scientists to determine the best methods for collecting and analyzing data.
What does "HBR Guide to Data Analytics Basics for Managers" say about analyzing data?
- Regression Analysis: The book explains regression analysis as a key tool for understanding relationships between variables.
- Predictive Analytics: It discusses how predictive analytics can forecast future trends based on past data.
- Avoiding Overfi tting: Warns against overfi tting models to data, which can lead to inaccurate predictions.
- Understanding Assumptions: Emphasizes the importance of understanding the assumptions behind data models.
How does "HBR Guide to Data Analytics Basics for Managers" recommend communicating data findings?
- Clear Storytelling: Use storytelling techniques to make data insights compelling and understandable.
- Visualizations: Employ effective data visualizations to highlight key points and trends.
- Audience Consideration: Tailor communication to the audience's level of understanding and interest.
- Actionable Insights: Focus on presenting data in a way that leads to actionable business decisions.
What common mistakes in data analysis does "HBR Guide to Data Analytics Basics for Managers" highlight?
- Confirmation Bias: Avoid focusing only on data that supports preconceived notions.
- Overconfidence: Be wary of overestimating the accuracy of data-driven insights.
- Ignoring Outliers: Pay attention to outliers, as they can provide valuable insights or indicate errors.
- Complex Models: Simplify models to avoid overfitting and ensure they are understandable and actionable.
How does "HBR Guide to Data Analytics Basics for Managers" define the role of a data scientist?
- Hybrid Role: Data scientists are described as a mix of data hacker, analyst, communicator, and trusted adviser.
- Curiosity: They possess an intense curiosity to explore data and uncover insights.
- Communication Skills: Effective data scientists can communicate complex data insights in a clear and compelling way.
- Business Impact: They focus on using data to drive business decisions and innovations.
What does "HBR Guide to Data Analytics Basics for Managers" say about the importance of data visualization?
- Clarity: Visualizations should make complex data more understandable and accessible.
- Engagement: Good visualizations engage the audience and highlight key insights.
- Avoiding Clutter: Avoid unnecessary elements that can distract from the main message.
- Purpose-Driven: Visualizations should be designed with a clear purpose and audience in mind.
How does "HBR Guide to Data Analytics Basics for Managers" address the challenge of uncertainty in data?
- Understanding Uncertainty: It explains the importance of recognizing and communicating uncertainty in data analysis.
- Probability and Risk: Discusses how to convey the probability of different outcomes and associated risks.
- Visualizing Uncertainty: Offers strategies for visualizing uncertainty to help stakeholders understand potential variability in results.
- Decision-Making: Emphasizes the need to incorporate uncertainty into decision-making processes.
What advice does "HBR Guide to Data Analytics Basics for Managers" offer for making data-driven decisions?
- Data-Driven Culture: Foster a culture that values data-driven decision-making across the organization.
- Continuous Learning: Encourage ongoing learning and adaptation as new data and insights become available.
- Collaboration: Work closely with data scientists and other experts to leverage their skills and insights.
- Balanced Approach: Combine data insights with intuition and experience to make well-rounded decisions.
About the Author
Other books by Harvard Business Review









Download PDF
Download EPUB
.epub digital book format is ideal for reading ebooks on phones, tablets, and e-readers.








