

Key Takeaways
A statistic is only as trustworthy as the choices that produced it.
The sample leaves fingerprints. A report put the average income of Yale’s class of 1924 at $25,111. But it could not include every graduate: some addresses were missing, and some alumni did not answer the questionnaire. Those who replied may have been better off than those who did not, so the number could describe respondents rather than the whole class.
Count what was measured. The same distinction appears in Darrell Huff’s father-in-law, who inferred that California had more crime after moving there and reading a newspaper that devoted more space to local crime. He had measured coverage, not crime. Before accepting a statistic, ask what population or behavior it actually represents.
What's striking is that the arithmetic may be flawless while the conclusion is not. Survey researchers call one version of this nonresponse bias: people who answer can differ systematically from people who do not. A large sample does not automatically solve that problem, and statistical weighting cannot reliably correct differences that were never measured. The useful habit is to identify the target group first, then ask who is absent and whether their absence could change the result.
A huge poll can still represent the wrong people.
Size cannot fix coverage. In 1936, the Literary Digest surveyed millions of people and forecast a decisive win for Alf Landon over Franklin Roosevelt. Roosevelt won. The magazine had drawn names from telephone and subscriber lists, which at the time overrepresented people with more money and tilted the sample away from the electorate as a whole. A poll can be enormous and still ask the wrong slice of the public.
People affect answers. In another study, Black respondents in a Southern city gave different answers about race relations depending on whether interviewers were Black or white. Interviewer identity, question wording, access, and respondents’ wish to give an acceptable answer can all shape results. A sample is not simply a pile of people. It is a process for reaching them and asking them.
This distinction anticipates a central idea in survey methodology: the sampling frame defines who can appear in the data at all. Random selection within a flawed frame does not make the frame representative. Interviewer effects also show that measurement is interactive, not passive. Modern polls can test wording and collection modes, but there is no frictionless view of public opinion. Results are answers produced under particular conditions, not unfiltered access to what everyone thinks.
Never accept an average until you know which one it is.
Three averages, three stories. The mean adds every value and divides by the number of values. The median marks the midpoint, with half the values above and half below. The mode is the most common value. Huff illustrates the difference with a neighborhood where most households earn modest incomes but a few millionaire residents raise the mean to $15,000, while the median is only $3,500. Both numbers can be correctly calculated, yet they answer different questions.
Skew changes the picture. Income distributions often have a long upper tail, so a few very high incomes pull the mean away from what most people earn. For a roughly symmetrical measure, such as height in a group, the three averages may be similar. When a report says only average, ask which measure it uses and what the distribution looks like.
The choice of average is a choice about what counts as representative. The mean is useful for totals and some mathematical operations, while the median often better describes a typical person in a skewed distribution. Neither is inherently honest or dishonest. The key is fit between the measure and the question. Reporting several summaries, or a distribution, can prevent a single convenient number from standing in for a complicated population.
Demand the range and uncertainty behind every tidy estimate.
A point estimate hides variation. A family size of 3.6 sounds like a natural blueprint for housing, but Huff notes that families of three or four made up only 45 percent of the households in the figures he cites. Thirty-five percent had one or two members, and 20 percent had more than four. Building mainly for the average family overlooked most households.
Small studies can be inconclusive. A polio vaccine test included 450 vaccinated children and 680 controls, yet neither group had a case during the observation period. At the usual rate, only about two cases were expected across the groups, too few to judge the vaccine. A result needs context: sample size, expected variation, and a range of plausible values, not just a headline number.
This lesson links statistical uncertainty to good design. A planner who sees only a mean may build for a household that barely exists; a researcher who sees no events in a small trial may mistake lack of evidence for evidence of no effect. Modern practice often reports confidence intervals, but an interval still depends on assumptions about sampling and measurement. It cannot account for every hidden bias, so uncertainty should be described rather than treated as a decorative margin.
A measurable difference may be too small to matter.
Numbers need scale. A laboratory comparison of cigarette smoke found that brands were nearly alike in the harmful substances measured. An advertiser then promoted Old Gold because it ranked lowest, while leaving out how tiny the difference was. The rank was real; the dramatic implication was not supported by the size of the gap.
Chance also matters. A test of a small group can produce an impressive-looking result simply through random fluctuation. Huff describes a toothpaste trial involving only twelve people: if a company repeats enough small tests, one may show a favorable outcome by chance. Statistical significance helps assess whether an observed difference could plausibly arise from chance, but it does not tell readers whether that difference is important in everyday life.
Two questions are often collapsed: Is a result distinguishable from random noise, and is it large enough to matter? They are not the same. With enough observations, a tiny effect can become statistically detectable; with too few, a meaningful effect can remain uncertain. There is also a technical caution: a conventional significance level is not the probability that a claim is true. Readers need the effect size, uncertainty, and practical consequences alongside the test result.
Inspect a graph’s axes before believing its drama.
The scale edits the story. Huff shows a chart of national income rising 10 percent over a year. With the vertical axis starting at zero, the rise looks moderate. Cut off most of the axis and the same line appears to surge. Change the proportions of the chart and the increase looks more dramatic still, though the underlying figures have not changed.
Pictures magnify dimensions. If a pictogram doubles both the height and width of an object to represent twice as much, its drawn area becomes four times as large. A three-dimensional object can suggest eight times the volume. Huff describes an industry chart that used oversized blast furnaces to make a roughly one-and-a-half-fold increase in steel capacity look far greater. Check scales, baselines, and what a picture’s size encodes.
Charts communicate through perception before readers inspect labels. That makes visual design part of statistical reasoning, not mere decoration. A truncated axis can be appropriate when clearly marked and used to examine small changes, but it should not silently imply a larger one. Pictorial charts pose an extra problem because people intuitively compare area and volume, even when the data encode only height. Honest graphics make the mapping between quantity and shape easy to see.
Make sure the number measures the thing being claimed.
A proxy can change the subject. Huff calls a weakly connected statistic a semiattached figure: a number that is genuine but does not directly establish the advertised conclusion. A laboratory report that a liquid killed germs in a test tube, for example, does not prove that it cures a cold in a human throat. Likewise, a juicer advertised as extracting 26 percent more juice was compared with a hand reamer, not necessarily with competing machines.
Use the relevant denominator. More highway deaths at 7 p.m. than at 7 a.m. do not establish that an individual driver is four times less safe in the evening; more people may be driving then. Comparing transport risks calls for rates relative to exposure, such as fatalities per passenger mile, rather than raw totals alone.
This is a problem of construct validity: whether a measure actually captures the concept named in the claim. It also explains why denominators matter. A count describes burden, while a rate can describe risk, and the choice depends on the decision being made. Even a carefully chosen rate can mislead if groups differ in age, health, or exposure. The best comparison matches the question and makes its assumptions visible.
Correlation can show a pattern without identifying its cause.
Co-movement is not explanation. Huff discusses a study finding that college smokers earned lower grades than nonsmokers. Even if the association is real, it does not show that smoking lowered grades. Poor grades might influence smoking, or a third factor, such as social habits, might affect both. The same caution applies when people with college degrees earn more: their prior ability or family resources may help explain the difference.
Look for other pathways. Two trends can rise together because both respond to a broader change, or because their relationship changes at different levels. Huff notes that more rain may help crops up to a point, while very heavy rain can damage them. A correlation is evidence of a pattern in the observed data. To support a causal claim, one needs a design or argument that distinguishes competing explanations.
Causal inference asks a harder question than whether two variables move together: what would have happened to the same people or units under a different condition? Randomized experiments can help answer that question, while observational studies must address confounding and selection. They can still be valuable, especially when experiments are impractical, but their causal conclusions require explicit assumptions. A persuasive number should narrow the alternatives, not simply choose the explanation its sponsor prefers.
Demand the denominator behind percentages and the baseline behind trends.
Percentages need their base. A labor report gave a figure of 4.9 percent for household jobs paying a particular wage. That percentage came from just two cases out of 41 offers. The raw count makes the scale of the evidence clearer. Percentages can also shift when their base changes: a 20 percent raise after a 20 percent pay cut does not restore the original wage, because the raise applies to a smaller amount.
Changes do not simply add. A 50 percent discount followed by another 20 percent discount is a 60 percent reduction from the original price, not 70 percent. Similarly, a company can describe the same earnings as a share of sales, a return on investment, or a change from a selected year. Ask what the denominator and comparison point are before interpreting the percentage.
Percentages are relational quantities, so they carry an invisible reference value. Without that base, a percentage can sound precise while remaining hard to interpret. This is especially important when comparing growth from unequal starting points: a small base can produce a large percentage change even when the absolute change is modest. Good reporting gives both the rate and the underlying counts or amounts, allowing readers to understand scale as well as direction.
Run five tests before a statistic earns your belief.
Turn skepticism into a routine. Huff’s closing method is a short audit of the evidence, not a reason to reject numbers wholesale. Ask:
1. Who produced the statistic, and what might they gain from it?
2. How were the data collected, and who could not or did not participate?
3. Which counts, ranges, comparisons, or uncertainty measures are absent?
4. Does the measured quantity match the conclusion being drawn?
5. Does the result make sense when checked against ordinary experience and other evidence?
Follow the chain. A statistic passes through collection, classification, calculation, presentation, and interpretation. Distortion can enter at any link, even without deliberate fraud. The more consequential the claim, the more important it is to trace that chain rather than be impressed by decimal places, institutional names, or a confident chart.
The checklist is useful because it converts statistical literacy into questions that can be asked without advanced mathematics. It also keeps skepticism disciplined: a weak report is not proof that the opposite claim is true. In practice, the questions work best together. A reputable source can still have a poor sample, and a representative sample can still measure the wrong thing. The goal is calibrated trust, with confidence proportional to the quality and relevance of the evidence.
Analysis
Huff’s central achievement is to move statistical skepticism upstream. Readers often encounter a polished average, percentage, or chart and assume the danger lies in bad arithmetic. The more consequential choices usually happen earlier: who enters the sample, how a category is defined, which baseline is selected, what counts as an outcome, and which comparisons reach the page. Calculation can be exact while the path from observation to conclusion remains biased.
The book’s examples make this argument memorable because they show the same data supporting sharply different impressions. A neighborhood mean rises when a few millionaires are included. A line graph becomes alarming when its baseline disappears. A real association is mistaken for cause. These are not merely tricks by dishonest advertisers. They are failures of measurement and interpretation that can occur through incentives, convention, haste, or an unexamined assumption. Huff’s attention to both deliberate manipulation and ordinary incompetence is therefore more useful than a simple warning to distrust experts.
The book also benefits from an important modern qualification. Statistical significance does not establish that a claim is true, and failure to reach a threshold does not prove that an effect is absent. Effect size, uncertainty, study design, and the consequences of error all matter. Likewise, random sampling addresses selection uncertainty only under its assumptions. It does not repair misleading questions, inaccurate responses, or a mismatch between the measure and the claim.
Some examples are tied to the media and institutions of the 1950s, but the underlying problems persist wherever evidence is compressed for persuasion. The enduring skill is not suspicion of numbers; it is tracing what a number represents. Readers who ask about population, measurement, comparison, uncertainty, and incentive can resist manipulation without surrendering the ability to learn from quantitative evidence.
Review Summary
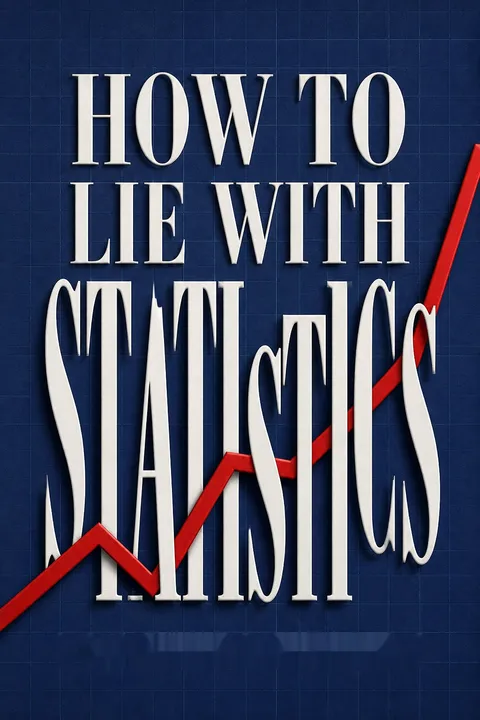
How to Lie with Statistics is widely praised as a timeless, accessible guide to understanding and critically evaluating statistical information. Readers appreciate its clear explanations, humor, and practical examples that expose common tricks used to mislead with data. Many consider it essential reading for developing statistical literacy and critical thinking skills. While some find the dated examples charming, others wish for more modern content. Overall, reviewers highly recommend the book for its valuable lessons on interpreting statistics in everyday life.
People Also Read






Glossary
statisticulation
Misleading through statistical materialHuff’s term for misinforming people by manipulating or presenting statistical material in ways that distort its meaning. The distortion may be deliberate, but it can also arise through incompetence, selective reporting, oversimplification, or choices made by people who pass results from researchers to the public.
semiattached figure
A number weakly tied to its claimA genuine or apparently genuine statistic that is presented as evidence for a conclusion it does not actually establish. A laboratory result about germs in a test tube, for example, does not by itself prove that a treatment cures an illness. The figure may be accurate while the connection to the claim is misleading.
stratified random sampling
Random sampling within defined groupsA sampling method that divides a population into categories, such as age or income groups, then selects people from those categories in intended proportions. It can be more practical than drawing a purely random sample from everyone, but it depends on accurate categories and on reaching people randomly within each group.
probable error
An older measure of estimate uncertaintyA measure Huff uses to express uncertainty in a sampled estimate. In his account, a probable error gives a range expected to contain the true value in half of repeated cases. It describes sampling precision, not whether a test measures the right thing or whether the sample is biased.
standard error
Estimated sampling variabilityA measure of how much a sample statistic would typically vary across repeated samples from the same population. Huff describes it as a more convenient alternative to probable error and notes that, under familiar assumptions, a range of one standard error covers about two-thirds of cases. It does not capture every source of bias.
post hoc fallacy
Mistaking association for causationThe error of concluding that one event or condition caused another simply because they occur together or one follows the other. Huff emphasizes that a correlation may result from chance, reverse influence, or a third factor affecting both variables. Establishing causation requires evidence that can distinguish among these explanations.
normal distribution
A symmetric, bell-shaped distributionA distribution in which values cluster around a central point and become less common toward either extreme, producing a roughly symmetric bell shape. In such a distribution, the mean, median, and mode coincide or lie close together. Huff contrasts this with skewed distributions, such as income, where a few extreme values can pull the mean away from the median.
FAQ
What's "How to Lie with Statistics" about?
- Overview: "How to Lie with Statistics" by Darrell Huff is a guide to understanding how statistics can be manipulated to mislead or deceive.
- Purpose: The book aims to educate readers on the common tricks used in presenting statistical data that can distort the truth.
- Content: It covers various statistical methods and how they can be used to create false impressions, from biased samples to misleading graphs.
- Illustrations: The book is illustrated by Irving Geis, which helps in visualizing the concepts discussed.
Why should I read "How to Lie with Statistics"?
- Critical Thinking: It enhances your ability to critically analyze statistical information presented in media, advertisements, and research.
- Awareness: The book raises awareness about the potential misuse of statistics in everyday life.
- Practical Examples: It provides practical examples and anecdotes that make the concepts relatable and easier to understand.
- Self-defense: Reading it equips you with the knowledge to defend against being misled by statistical manipulation.
What are the key takeaways of "How to Lie with Statistics"?
- Bias in Sampling: Be wary of biased samples that do not represent the whole population accurately.
- Misleading Averages: Understand the difference between mean, median, and mode, and how they can be used to mislead.
- Graphical Deception: Recognize how graphs can be manipulated to exaggerate or minimize trends.
- Correlation vs. Causation: Learn to differentiate between correlation and causation to avoid false conclusions.
What are the best quotes from "How to Lie with Statistics" and what do they mean?
- "There are three kinds of lies: lies, damned lies, and statistics." This quote, attributed to Disraeli, highlights how statistics can be used to deceive.
- "Statistical thinking will one day be as necessary for efficient citizenship as the ability to read and write." H.G. Wells emphasizes the importance of understanding statistics in modern society.
- "Round numbers are always false." Samuel Johnson suggests skepticism towards overly neat figures, as they often oversimplify complex data.
- "It ain’t so much the things we don’t know that get us in trouble. It’s the things we know that ain’t so." Artemus Ward warns against false beliefs, which can be perpetuated by misleading statistics.
How does Darrell Huff explain the concept of "The Sample with the Built-in Bias"?
- Definition: A biased sample is one that does not accurately represent the population it is supposed to reflect.
- Example: Huff uses the example of Yale graduates' income, where only those with known addresses and who responded were included, skewing the results.
- Impact: Such samples can lead to conclusions that are not reflective of the true situation, often exaggerating or minimizing the reality.
- Solution: Ensure samples are random and representative to avoid built-in biases.
What does "The Well-Chosen Average" mean in the context of the book?
- Different Averages: Huff explains the difference between mean, median, and mode, and how each can tell a different story.
- Manipulation: By choosing a specific type of average, one can present data in a way that supports a particular narrative.
- Example: A neighborhood's average income can appear high or low depending on whether the mean or median is used.
- Critical Evaluation: Always question which type of average is being used and why.
How are "The Little Figures That Are Not There" used to mislead?
- Missing Data: Important figures like sample size or error margins are often omitted, leading to misleading conclusions.
- Range and Deviation: Without understanding the range or deviation, an average can be meaningless.
- Example: Housing statistics based on average family size can misrepresent the needs of the population.
- Awareness: Look for missing figures that could change the interpretation of the data.
What is the "Gee-Whiz Graph" and how does it deceive?
- Graph Manipulation: Graphs can be manipulated by truncating axes or changing scales to exaggerate trends.
- Visual Impact: A small change can appear significant if the graph is designed to mislead visually.
- Example: A ten percent increase can look like a dramatic rise if the graph is truncated.
- Critical Viewing: Always check the scales and axes of graphs to understand the true data.
How does "The One-Dimensional Picture" mislead readers?
- Pictorial Graphs: These use images to represent data, which can exaggerate differences through size manipulation.
- Misleading Impressions: A larger image can suggest a much greater difference than the data supports.
- Example: A moneybag representing income can be drawn larger to imply a bigger disparity.
- Skepticism: Be cautious of pictorial representations that may distort the actual data.
What is the "Semiattached Figure" and how is it used?
- Definition: This involves using a figure that is related but not directly relevant to the claim being made.
- Example: Claiming a product kills germs in a test tube to imply it cures colds in humans.
- Misleading Correlation: It creates a false sense of causation or relevance.
- Critical Questioning: Always ask how the figure is related to the claim being made.
How does the book address the fallacy of "Post Hoc"?
- Post Hoc Fallacy: Assuming that because one event follows another, the first caused the second.
- Example: Correlating smoking with low grades without considering other factors.
- Multiple Explanations: There may be other factors causing both events, or the relationship may be coincidental.
- Skeptical Analysis: Always consider alternative explanations for correlations.
How can readers "Talk Back to a Statistic" according to Darrell Huff?
- Question the Source: Consider who is presenting the statistic and their potential biases.
- Check the Methodology: Look into how the data was collected and whether the sample was representative.
- Look for Missing Information: Identify any missing data that could alter the interpretation.
- Evaluate the Logic: Ensure the conclusions drawn from the data make logical sense and are not based on faulty assumptions.
Download PDF
Download EPUB
.epub digital book format is ideal for reading ebooks on phones, tablets, and e-readers.








