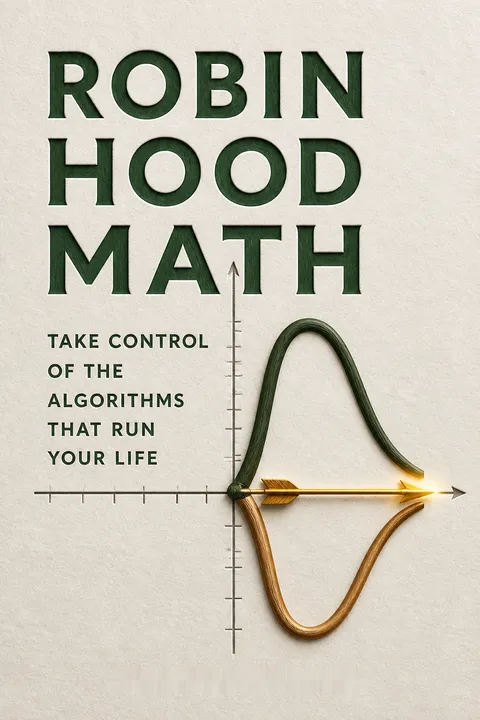


Key Takeaways
Use math as counter-power when institutions turn your life into scores
Numbers shape ordinary life. A phone feed, job application, credit score, and hospital waiting list can all reduce a complicated person to a number. Giansiracusa calls this numerification: assigning numbers to complex human activities so institutions can compare, predict, and manage them. Modern devices make this process unusually extensive. A connected car, for instance, may generate about 25 gigabytes of data an hour, while grocery stores collect and trade customer information.
Math can be reclaimed. Robin Hood math means making the quantitative tools used by governments and corporations understandable and useful to ordinary people. It cannot stop institutions from scoring people, but it can help people inspect those scores, make better decisions, and push back against manipulation.
The book’s opening move makes mathematics a question of power, not merely calculation. A score can make a sprawling system governable, but it can also conceal whose priorities count and whose experience gets erased. This is a useful distinction: quantification is not automatically dehumanizing, since measures can expose unequal treatment or guide scarce resources. The danger arises when a measure is mistaken for the whole person, or when the people being measured cannot question the rules. Mathematical literacy here means learning to audit the lens, not rejecting every number.
Build rankings around your priorities, not a magazine's hidden weights
A ranking is a recipe. Most systems turn several measures into one score by standardizing them and combining them with weights. A weighted sum lets the designer decide which factors count most. In 2023, U.S. News changed its college-ranking weights, dropping class size from 8 percent to zero. Brandeis fell from 44th to 60th despite reporting a similar underlying score. The result reflected a changed recipe, not a sudden transformation in the school.
Personalize the ingredients. To compare colleges, cities, or even dog breeds, choose relevant factors, rank each option on them, and assign weights that reflect personal priorities. Then vary those weights. If the winner changes easily, the ranking is fragile. Columbia’s disputed data and the World Bank’s pressured country rankings show why official scores deserve scrutiny.
Personalized rankings make value judgments visible instead of disguising them as neutral arithmetic. This resembles a well-designed decision aid: it organizes competing priorities without pretending to eliminate them. Sensitivity testing is especially valuable because a single winner can look decisive while depending on a tiny adjustment in weights. The method does have limits. Rank-ordering loses information about how large the differences are, and users can choose factors based on incomplete or biased data. Its strongest use is to clarify a decision, not to manufacture certainty.
Average independent forecasts, because shared blind spots survive averaging
Crowds can improve estimates. In 1906, Francis Galton collected about 800 guesses of an ox’s dressed weight. The middle guess missed the actual weight by only nine pounds. Averaging works because overestimates and underestimates can offset each other. A weighted average improves the method by giving more influence to forecasts with stronger evidence or a better track record.
Agreement is not independence. Covariance describes how much two sets of errors move together. When forecasters share the same blind spot, their errors reinforce rather than cancel. Nate Silver combined polling organizations instead of trusting only one, and a COVID forecasting group led by Nicholas Reich combined models that had performed well in recent weeks. Neither averaging nor expertise guarantees accuracy: shared assumptions, as in a tight election or a fast-changing outbreak, can still mislead.
The key insight is not simply that groups are wise, but that useful groups contain partially independent errors. This connects forecasting to institutional design: a panel with varied methods can add information, while a panel that shares training, incentives, or assumptions may only create the appearance of consensus. Weighting offers a practical compromise between treating every forecast as equal and betting everything on one celebrated expert. Yet past performance is only a guide when the future resembles the past. A forecast ensemble should expose disagreement, not smooth it into false confidence.
Use expected value for repeatable bets, not as a complete moral compass
Calculate the average payoff. Expected value is found by multiplying each possible outcome’s value by its probability, then adding the results. If a fair coin game pays $3 for heads and $1 for tails, its expected payout is $2. The calculation helps explain how insurers, casinos, and lotteries set prices, and why professional gamblers look for a small, repeatable edge.
Do not confuse averages with lives. A lottery ticket can be worth the anticipation even when its financial expected value is negative. Insurance can be rational because a rare loss may be devastating. Sam Bankman-Fried’s relentless expected-value thinking also illustrates the danger of ignoring consequences that are hard to quantify, such as broken trust. Expected value is most useful when outcomes are clear, decisions repeat, and one loss cannot end the game.
Expected value is powerful because it disciplines intuition about uncertain outcomes. Its weakness is not mathematical but ethical and practical: the calculation includes only outcomes that someone chooses to list and value. Reputation, obligation, and irreversible harm can disappear from the model simply because they resist measurement. The book’s boundary condition is therefore essential. Use the formula for bounded, repeatable choices, but treat it as an input to judgment rather than a machine that decides what matters. A clean calculation cannot repair an incomplete account of consequences.
Inspect the spread, not just the average, before accepting risk
Averages hide uneven outcomes. During the 2021-2022 NBA season, average player salary was about $8.5 million, but the median was $4.3 million. Nearly 20 percent of players earned between $1 million and $2 million, the most common salary range. The distribution tells a more useful story than the average alone. A histogram, which groups observations into ranges, makes those differences visible. Variance measures how spread out the outcomes are around their average.
Spread changes the risk. A forecast that mortgage rates will fall by two points means something different if most scenarios cluster near that value than if outcomes vary wildly. The Pacific Northwest’s major earthquakes averaged about 243 years apart, yet a past gap lasted roughly 750 years. An average interval does not function like a calendar.
Thinking in distributions corrects a deep habit of treating the typical case as the likely experience of every individual. The distinction matters in careers, health, and disaster planning, where a small chance of an extreme outcome can dominate the decision. Averages remain useful summaries, but they should be paired with ranges, percentiles, or plausible worst cases whenever the stakes are high. There is also a communication challenge: vivid rare outcomes can overwhelm judgment just as averages can hide them. Good risk thinking keeps both the common and the consequential in view.
Price the harm of inaction as carefully as the harm of action
Count both paths. Paul Romer’s rule of thumb for pricing risk starts by estimating the harm if a bad outcome occurs, multiplies that amount by the probability of the outcome, and doubles the result. The doubled expected loss gives a rough cost for comparison with an available preventive action. It is a practical approximation, not a precise law.
A small chance can matter. In the book’s example, a virus has a 10 percent chance of keeping someone from work for a week. If that lost income is $1,250, expected loss is $125, and Romer’s doubled estimate is $250. A treatment costing $200 may therefore be worth considering, even though the person is more likely to recover quickly without it. The same reasoning can prevent people from overweighing vaccine risks while ignoring the risks of infection.
The method counters omission bias: people often experience a risky action as a choice, while treating the risk of doing nothing as background. Putting both options on the same ledger can reveal that apparent caution is also a gamble. The doubling rule is intentionally rough, which makes it accessible but also limits its precision. Estimating the harm and probability remains subjective, and a dollar figure can flatten nonfinancial losses. Its best role is to force neglected costs into the discussion, not to settle every value judgment.
Bet a fixed fraction, so one bad outcome cannot end the game
Size bets for survival. In a game where a favored outcome has probability 60 percent and a win doubles the wager while a loss removes it, the Kelly strategy recommends wagering 20 percent of the current bankroll each round. The rule for this simple even-money game is 2p minus 1, where p is the chance of winning. Bets grow when the bankroll grows and shrink after losses.
Avoid the all-in trap. In Victor Haghani’s biased-coin experiment, participants were given a coin that landed heads 60 percent of the time. Seventeen of 61 lost their entire stake, although a fixed-percentage approach could have protected them from many wipeouts. In real investments, probabilities are uncertain, so a more cautious half-Kelly approach is often discussed. The principle is to preserve the ability to keep playing.
This is a bridge between favorable odds and sustainable behavior. A positive average return does not protect someone who risks so much that one bad sequence ends participation. The fixed-fraction approach also reflects diminishing returns: losing half a bankroll requires a 100 percent gain just to recover, so avoiding deep losses has special value. The formal optimum depends on the probabilities being accurate and the payout structure matching the model. In markets, both assumptions are shaky. Position sizing should therefore shrink as confidence in the estimate falls.
Update prior beliefs with evidence, instead of letting one clue hijack you
Evidence changes a starting belief. Bayes’s formula describes how to revise a probability when new information arrives. It combines an initial estimate with how likely the evidence would be if the belief were true, compared with how common that evidence is overall. This helps avoid treating a test result or striking event as decisive without considering its background rate.
Base rates matter. In the book’s hypothetical COVID 2.0 example, 10 percent of people with flu symptoms have the virus. A test with 80 percent sensitivity and a 5 percent false-positive rate yields a 64 percent chance of infection after a positive result, not 95 percent. Giansiracusa also offers a rough mental shortcut, the Bayes-made-easy procedure: translate probabilities into a simple scale and update with A minus B plus C. Its estimates are approximate, but they encourage calibrated revision.
Bayesian reasoning is useful because it treats belief as a process rather than a verdict. A new signal should matter in proportion to how much more likely it is under one explanation than another. That logic is valuable in medicine, journalism, and everyday suspicion, where vivid evidence can overpower context. The shortcut lowers the barrier to using the idea, but its numerical simplicity can hide difficult judgments about the prior and the reliability of evidence. Its most durable contribution may be the questions it teaches people to ask before changing their minds.
Train feeds deliberately, because every comment is an algorithmic vote
Platforms score expected engagement. Facebook and TikTok estimate how likely a person is to Like, comment, share, or keep watching, assign values to those actions, and rank posts using a weighted score. That can elevate content that provokes anger as readily as content that brings pleasure. TikTok’s viral nonsense riddle succeeded partly because viewers replayed it and argued over what it meant, generating exactly the activity the system rewarded.
Send signals on purpose. On Facebook, the angry reaction was reduced to zero points, while comments still counted as engagement. On TikTok, repeated viewing and comments can signal interest even when the viewer is irritated. To shape a feed, engage with material worth seeing again and move past unwanted bait without watching repeatedly or replying.
The useful shift is from asking whether a platform understands a user to asking which behaviors its ranking system can observe. Engagement is a crude proxy for preference: a comment may express outrage, not enthusiasm, but the signal can be indistinguishable to a system optimizing interaction. That is a design problem, not merely a user problem. Deliberate behavior can improve a feed, though it cannot fully overcome platform incentives or hidden ranking adjustments. User agency is real, but it operates inside a system built to capture attention.
Treat ranked marketplaces as interested parties, not neutral guides
A top result may be a sale. The Markup examined nearly 3,500 popular Amazon searches and found that 60 percent placed a sponsored item first. Among top results that were not labeled as ads, half favored an Amazon-owned or Amazon-exclusive brand, even though those products made up only 6 percent of the products examined. A study cited in the book found that shoppers using the default Featured order paid 25 percent more than the best available deal, on average.
Change the search method. On Amazon, sort by price or customer reviews, then compare ratings and details rather than trusting the default order. On Google, use the Web tab to reduce clutter, or narrow results with operators such as minus signs, site: and filetype:. These small tools make search less dependent on the platform’s preferred ranking.
The central issue is a conflict of roles: a marketplace can host sellers while competing against them, and a search engine can present information while selling the most visible space. This resembles a referee with a stake in the match. Sorting tools and independent comparisons help, but they do not cure structural conflicts or guarantee good information. The reader’s practical advantage comes from treating placement as evidence of the platform’s priorities, not as proof of quality. Transparency about the ordering criteria would make that skepticism easier to apply.
Make ad-funded platforms answer for costs they push onto everyone
Free services still have costs. Advertising pays for much of the internet, but the model rewards scale, intensive tracking, and time spent on platforms. The book describes Facebook’s free internet access in the Philippines, which helped make the platform a primary gateway for many users, while engagement-driven feeds also provided fertile ground for misinformation. Privacy loss, addictive design, and harmful content are costs that fall on the public, not just the company.
Change the incentive, not only the symptom. A progressive tax on targeted-ad revenue could make very large platforms pay more and reduce the advantage built from exclusive user data. Revenue could support public-interest journalism or public-service digital spaces. The author also proposes increasing the tax as ad targeting becomes more personally granular. This is a policy proposal, not an established fix, but it aims at the economic incentives behind the harms.
The argument moves from individual literacy to institutional responsibility. A user can adjust a feed or avoid a sponsored result, but cannot independently change the business model that rewards surveillance and engagement at enormous scale. An ad tax tries to make some external costs visible in company accounts, much like pollution pricing does for environmental damage. Its success would depend on careful definitions, enforcement, and safeguards against unintended effects on smaller publishers. The broader principle is strong: consumer choice alone is an inadequate remedy when firms shape the choices and capture the benefits.
Analysis
Robin Hood Math is a practical introduction to quantitative reasoning, but its deeper subject is who gets to define the numbers that organize public and private life. Its structure follows a compelling progression: first, ordinary people are rendered as data; then the reader learns to inspect ranking systems, combine forecasts, evaluate uncertain choices, update beliefs, and understand recommendation algorithms. The closing move is political. Individual techniques can help a person navigate platforms, but the incentive structures behind surveillance and engagement require collective remedies.
The book’s strongest pedagogical choice is to make formulas travel across settings. Weighted sums connect college rankings to inflation and social feeds. Covariance links crowd estimates, court judgments, and investment risk. Bayes’s formula turns a technical relationship into a habit of asking how evidence changes an initial belief. This repetition reveals that mathematics is not a collection of isolated school procedures. It is a compact language for examining assumptions and tradeoffs.
Its most important caution is that arithmetic does not make a decision objective. A ranking depends on selected factors; an expected value depends on imagined outcomes and assigned values; a Bayesian update depends on a prior and evidence model. The book consistently exposes these choices, though its usable shortcuts can make uncertain inputs feel more settled than they are. The remedy is not to reject calculation, but to show assumptions, compare scenarios, and preserve room for moral judgment.
The book also distinguishes personal empowerment from structural reform. Users can shape recommendation feeds by changing engagement, search more strategically, and build custom rankings. Such tactics matter, but their scope is limited when platforms control the interface and profit from attention. The final policy case for taxing targeted advertising therefore completes, rather than abandons, the book’s central premise: mathematical literacy should help people understand the rules, improve their own decisions, and challenge institutions that wrote the rules without them.
People Also Read




Glossary
numerification
Turning activity into numbersThe assignment of numerical measures to complex human activities or traits so they can be tracked, compared, ranked, or managed. In the book, examples range from social media engagement and employee productivity scores to credit ratings and medical triage. Numerification can help institutions identify patterns, but it can also reduce people to measures that omit important parts of their lives.
Robin Hood math
Math for everyday peopleGiansiracusa’s name for making quantitative tools accessible to people outside finance, technology, and technical professions. The aim is to help ordinary readers understand how institutions use numbers, make clearer personal decisions, and challenge algorithmic or statistical systems that affect them. The metaphor frames mathematical knowledge as a resource that should not remain concentrated among powerful organizations.
weighted sum
A combined scoreA total created by multiplying each component score by an assigned weight and adding the results. A higher weight gives a factor greater influence on the total. Ranking systems use weighted sums to combine measures such as cost, outcomes, and reputation. The calculation is straightforward, but selecting the factors and weights involves judgments about what should matter.
weighted average
A weighted combined estimateA method of combining several estimates while giving some more influence than others. Each estimate is multiplied by its weight, the products are added, and the result is divided by the sum of the weights. It can improve forecasts when errors partly cancel and when higher-quality estimates receive sensible emphasis. It offers little protection when the estimates share the same bias.
variance
Spread around an averageA statistical measure of how widely values are dispersed around their average. Low variance means observations tend to cluster near the average; high variance means outcomes are more spread out. In the book’s discussion of risk, variance helps indicate how likely an actual result is to depart substantially from what an average forecast suggests.
covariance
How two sets move togetherA measure of whether two sequences of values tend to rise and fall together. Positive covariance indicates movement in the same direction, while negative covariance indicates movement in opposite directions. It matters when combining forecasts or diversifying investments: averaging is less protective when the errors or assets tend to move together.
expected value
Probability-weighted average outcomeThe sum of each possible outcome’s value multiplied by its probability. It estimates the average result across repeated instances of an uncertain situation. Expected value helps explain pricing in insurance, lotteries, and gambling, and can guide decisions with clear outcomes and repeatable trials. It does not capture every personal, ethical, or long-term consequence.
Kelly strategy
Bet a fraction of wealthA betting approach that wagers a fixed fraction of the current bankroll, with the fraction determined by the odds and payout structure. For the book’s simple even-money game, the fraction is 2p minus 1, where p is the probability of winning. The strategy aims to balance growth with the risk of ruin, but depends on reliable probability estimates.
Romer’s rule-of-thumb recipe for risk
A rough risk cost estimateA practical method for bringing uncertain harm into a cost-benefit comparison. First estimate the harm in monetary terms, then multiply it by the probability that it occurs. Double that expected loss to produce a rough cost of the risk. The method is an approximation intended to prompt useful comparisons, not a precise valuation of every kind of harm.
Bayes’s formula
A rule for updating beliefA mathematical relationship that shows how to revise the probability of an event after observing new evidence. It combines an initial probability with how likely the evidence is under the event and how common the evidence is overall. The formula helps prevent new information from overwhelming prior knowledge, or being dismissed when it should change a belief.
Bayes-made-easy procedure
A rough probability updateGiansiracusa’s simplified way to apply Bayesian reasoning without calculating exact probabilities. The user maps an initial belief, the overall likelihood of new evidence, and the evidence’s likelihood if the belief is true onto a rough numerical scale, then combines them using A minus B plus C. It is intended for approximate belief updates, especially when precise inputs are unavailable.
Download PDF
Download EPUB
.epub digital book format is ideal for reading ebooks on phones, tablets, and e-readers.








