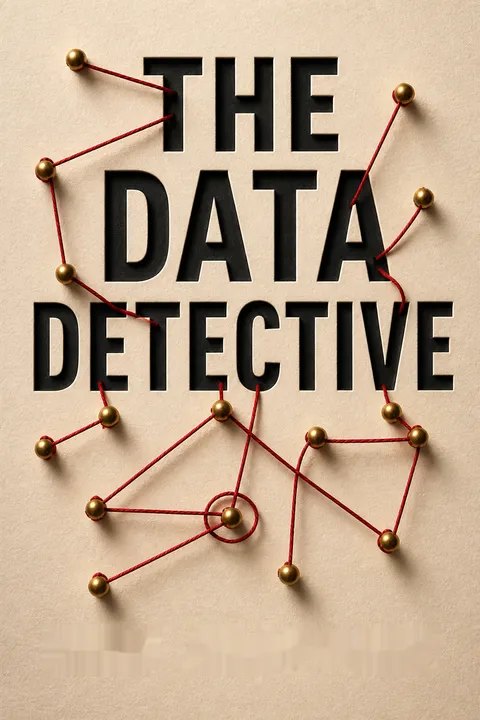


Key Takeaways
Use numbers to investigate reality, not to dismiss it reflexively
Statistics can clarify. A European comparison found that countries with more storks also had more babies. The relationship was real, but larger countries had more of both, so the pattern did not show that storks caused births. That is a warning against careless interpretation, not a reason to distrust numbers altogether. In the 1940s and 1950s, Richard Doll and Austin Bradford Hill compared lung cancer patients with similar hospital patients, then tracked thousands of doctors. Their evidence showed that heavy smokers faced roughly sixteen times the lung cancer risk of nonsmokers.
The method matters. Counting cases carefully, comparing relevant groups, and following people over time helped distinguish a dangerous cause from a coincidental pattern. The evidence persuaded doctors to quit smoking and helped prevent deaths. Statistics are not automatically truthful, but without systematic evidence, even a serious danger can remain invisible.
What's important here is the difference between skepticism and cynicism. Skepticism asks how a claim was measured and what else might explain the pattern. Cynicism treats every answer as suspect, which can protect a preferred belief as effectively as gullibility does. The smoking research also shows why evidence often accumulates through several designs rather than one perfect experiment. Still, a strong association alone is not a universal recipe for proving causation. The value lies in asking whether multiple forms of evidence converge, and whether the proposed explanation survives serious alternatives.
Pause when a number confirms exactly what you hope is true
Desire edits evidence. In 1937, leading Vermeer expert Abraham Bredius declared a newly surfaced religious painting a masterpiece. It was a modern forgery by Han van Meegeren, who had tailored it to Bredius's theories about Vermeer. The critic's expertise gave him more reasons to accept the painting, but his longing to find a missing masterpiece made him overlook a basic warning: it looked unlike Vermeer's other work.
Notice the reaction. Psychologists call reasoning shaped toward a desired conclusion motivated reasoning. In experiments, people assigned to benefit from high wheat prices tended to predict rising prices; those who benefited from cheap wheat forecast the opposite. Before sharing or rejecting a claim, notice whether it brings triumph, anger, or relief. That emotional signal is a reason to slow down, not proof that the claim is false.
What's striking is that bias does not require conscious dishonesty. People can sincerely search for evidence while applying harsher standards to unwelcome findings than to welcome ones. That makes a deliberate pause useful: it creates a chance to inspect the standards being used, not simply the conclusion. The same discipline can be institutionalized through blind review, where evaluators assess methods without knowing whose work they are judging. Emotional awareness is not a substitute for evidence, and it cannot erase identity or social pressure, but it can interrupt the quickest route from preference to certainty.
Treat personal experience as a clue, not as a representative sample
Averages can conceal experience. Tim Harford's London commute felt packed, despite official figures showing low average bus and train occupancy. Both accounts could be right: he traveled during rush hour, while the average included quiet services and trains running against the commuter flow. A statistic about the average train does not necessarily describe the journey taken by the average passenger.
Some patterns need scale. A family's experience cannot establish whether a treatment caused recovery, and an anecdote about a child diagnosed with autism after an MMR vaccine cannot test whether the vaccine increases risk. A Danish study following about 650,000 children found autism diagnoses at roughly the same rate among vaccinated and unvaccinated children. Personal experience can reveal questions and lived consequences; larger comparisons can test broader patterns.
This is a useful correction to the false choice between lived experience and statistics. In fields such as medicine and urban planning, quantitative averages can expose patterns that no individual can observe, while first-person accounts reveal burdens that a summary measure hides. The key is to match the evidence to the question: experience may show what happened to one person, but usually cannot establish what would have happened without an intervention. Conversely, a population average cannot dictate what an individual should feel or choose. Neither perspective is complete on its own.
Define the thing before you count it
Words shape the result. Tim Harford calls it premature enumeration: doing calculations before clarifying what the numbers represent. In the UK, hospitals differed in whether some pregnancies ending around twenty-two or twenty-three weeks were recorded as late miscarriages or live births followed by early deaths. That recording choice explained much of an apparent difference in newborn mortality between hospitals. The underlying outcomes had not changed; the labels had.
Specify the measure. A claim about inequality might concern income or net wealth, which can make a young professional with education debt appear poorer than someone with few assets but no debt. Oxfam's headline comparison of billionaires with the world's poorest half changed dramatically as its calculations were revised. Before judging a statistic, ask what was counted, who was included, and how the key terms were defined.
This principle reaches beyond statistics into law, medicine, and public administration: categories determine who becomes visible to a system and what action follows. A definition is not merely technical housekeeping when it changes a mortality rate or access to a service. Yet definitions are not always neutral choices with one obvious correct answer. Researchers should make their choices explicit, explain what alternatives would change, and avoid implying that a number settles the ethical question behind a category.
Give every statistic a timeline, comparison, and sense of scale
A snapshot can mislead. In 2018, London briefly recorded more murders than New York in one month. That narrow comparison said little about the long-term danger: London had 184 murders in 1990 and 130 in 2017, while New York fell from 2,262 to 292. Both cities had become much safer over that period, even though monthly counts still fluctuated.
Change the time frame. A short-news rhythm favors sudden, dramatic events; longer views reveal slower trends. A global snapshot of childhood survival, for example, shows the shift from about 32 deaths before age five per 100 children in 1918 to about four in 2018. Comparisons also establish scale: a proposed $25 billion US border wall amounted to about $75 per American, a more graspable figure than the total alone.
Context works like a denominator for attention: it helps distinguish a meaningful change from ordinary fluctuation and an alarming total from a consequential cost. The comparison must still fit the question. Per-person cost can clarify a budget, but it may obscure who pays or who benefits; a century-long trend can reveal progress while hiding a recent reversal. Context should widen interpretation, not preselect a comforting verdict. Readers benefit from asking what comparison would most change their understanding.
Look for the studies and failures that never made the headlines
Success stories survive. A famous jam experiment suggested that shoppers were far more likely to buy when offered six varieties than twenty-four. Later attempts to reproduce the finding did not confirm such a large effect. When researchers gathered published and unpublished studies, the average effect of more choice was close to zero. The original result was memorable; the failures and ordinary outcomes were much less visible.
Publication selects for surprise. In a project that repeated one hundred prominent psychology studies, only thirty-nine were judged to reproduce the original findings. Journals' preference for striking results, researchers' career incentives, and flexible analysis can all hide null findings. This is publication bias. For health decisions, the stakes can be serious: published antidepressant trials looked overwhelmingly positive until researchers found many unpublished or misreported negative results.
The lesson is not that published research is worthless, but that a paper is one observation about a research process, not the whole process. Preregistration, complete trial registries, and journals willing to publish negative results make that process easier to inspect. Replication also needs judgment: a failed repeat may reflect a fragile original effect, a different population, or a changed procedure. The strongest conclusions come from a transparent body of evidence, including reasonable attempts that did not produce the exciting result.
Ask who the data left out, including people who never responded
A huge sample can be tilted. In 1936, the Literary Digest received 2.4 million poll responses and predicted that Republican Alfred Landon would defeat Franklin Roosevelt. George Gallup, using a much smaller poll of about 3,000 people, predicted Roosevelt's victory. The Digest's lists overrepresented people with cars and telephones, and Landon supporters were more likely to reply. Its enormous sample estimated the wrong population precisely.
Missingness changes meaning. Early labor surveys in Uganda missed many women's work because they asked only for a primary occupation; asking about secondary activities revealed roughly 700,000 additional workers. Modern digital datasets have similar blind spots: a map built from smartphone reports may reflect who owns and uses those phones, not every pothole or resident. Ask which groups, experiences, and unanswered forms are absent.
Missing data are often a question of power as well as sampling. If unpaid work, domestic abuse, or a group's health outcomes are not collected, those problems become harder to address and sometimes harder even to describe. The remedy is not simply to gather more data: a larger survey can magnify the same exclusion, and intrusive collection can create privacy harms. Better practice identifies who is missing, explains why, and tests whether conclusions hold under plausible assumptions about those unobserved cases.
Demand evidence before letting a black-box algorithm decide someone's fate
Patterns are not explanations. Google Flu Trends once used search behavior to estimate flu cases faster than public health reports. It sometimes mistook seasonal searches for flu, then overstated an outbreak by more than double. Because its creators did not fully understand the links it had detected, the model was vulnerable when search habits or flu timing changed. A wolf detector can similarly learn to identify snow rather than wolves.
Test the decision, not the mystique. An algorithm used to assess teacher performance helped lead to 206 Washington, DC, teachers being fired in 2011, despite noisy student test scores. In criminal justice, a secret risk model required public records and outside audits before its accuracy and competing definitions of fairness could be examined. Compare algorithms with human decisions, disclose limitations, and demand independent evaluation where lives are affected.
Algorithms can reduce some human errors, such as inconsistent judgments, but they can also make old inequities look objective by encoding them in software. Transparency is necessary for scrutiny, though not sufficient for fairness: a model can be understandable and still rely on an unjust goal or distorted data. Evaluation should compare real outcomes across groups, disclose tradeoffs, and account for privacy. The relevant question is not whether computers are fairer than people in general, but whether this system improves this decision under clearly stated standards.
Protect independent public statistics; they are civic infrastructure
Reliable numbers need independence. The US Congressional Budget Office was designed to assess policy costs impartially, even when its conclusions displeased the party in power. Its annual budget was about $50 million, compared with roughly $4 trillion in federal spending. Even a tiny improvement in decisions could justify that cost.
Trust depends on safeguards. Greek statistician Andreas Georgiou faced repeated legal action after publishing a deficit estimate far higher than the government's initial figure. In Argentina, statistician Graciela Bevacqua was dismissed after resisting pressure to understate inflation. These cases show why official data need professional independence, public access, and protection from political interference. Such statistics are imperfect, but when they are suppressed or manipulated, citizens and decision-makers lose a shared basis for checking claims.
Public statistical agencies resemble infrastructure because their value is distributed across many users: businesses, researchers, local governments, journalists, and citizens all rely on the same basic measurements. Their independence matters most when findings inconvenience officials. Still, official status should not function as a seal of infallibility. Agencies need methods that can be audited, clear revision histories, privacy protections, and room for external criticism. Trust is strongest when institutions make it possible to test their work, rather than asking the public to trust authority alone.
Inspect a chart's argument, not just its beauty
A graph guides the eye. During the Crimean War, Florence Nightingale used a vivid circular diagram to show how deaths at a military hospital changed before and after sanitation improvements. After a sanitary commission cleaned the hospital, the death rate fell from more than 50 percent to about 20 percent. The diagram helped make the evidence memorable to officials who might never study a table of figures.
Visual force can mislead. A colorful infographic may compare unlike quantities, hide its definitions, or use a title and design that steer readers toward one conclusion. Even a chart with accurate numbers can be hard to compare or emotionally loaded. Check the axes, units, time span, and source. Ask whether the visual helps reveal a pattern or mainly makes a claim feel compelling.
Visual communication is powerful partly because perception is fast: a viewer often absorbs color, direction, and relative size before reading a caption. That makes design an ethical responsibility, not mere decoration. Nightingale's chart shows that advocacy and accuracy can work together when the underlying evidence is sound and available for inspection. However, a persuasive chart can encourage premature certainty. Readers should treat a graph as an argument to evaluate, while designers should make the relevant comparison easier to see than the visual flourish.
Keep score, update beliefs, and stay curious about being wrong
Good judgment is adjustable. Economist Irving Fisher kept betting on a rising market as his leveraged investments collapsed. John Maynard Keynes also failed to foresee the 1929 crash, but eventually abandoned his poor business-cycle forecasting strategy and changed how he invested. His willingness to learn from failure helped him recover.
Forecasting improves with habits. Philip Tetlock's research gathered 27,500 predictions from nearly 300 experts and found that expertise alone did not guarantee accuracy. In later forecasting tournaments, some participants improved by using basic probability, starting with base rates, keeping score, and updating their estimates as evidence changed. Curiosity helps people explore unwelcome information instead of defending a position. Asking someone to explain a policy in detail can expose gaps in understanding and soften overconfidence.
Open-mindedness is not indecision; it is a method for reducing the cost of being wrong. Forecasting tournaments make error visible, which memory and reputation often conceal. Base rates provide a useful starting point, while case-specific evidence can then revise the estimate. Not every important future event is predictable, and continual updating can become a distraction when new information is weak. The disciplined approach is to state uncertainty, track predictions, and change conclusions in proportion to evidence rather than to embarrassment or applause.
Analysis
The book's central argument is that statistical literacy is less about performing calculations than about asking better questions. A number is not a self-interpreting fact. It depends on definitions, collection practices, missing cases, comparison groups, incentives, and the human motives surrounding its use. Harford's examples repeatedly show that errors arise before arithmetic begins: an infant mortality rate changes when hospitals classify early births differently; a poll fails when millions of respondents differ from the voters it is meant to represent; an algorithm mistakes seasonal searches for disease. These are failures of framing and institutional design as much as failures of mathematics.
The narrative also resists two opposite temptations. The first is credulity, especially toward polished graphics, published research, and computational systems. The second is blanket distrust, which gives propagandists an easy route to dismiss inconvenient evidence. The book's practical alternative is calibrated trust: examine a claim's provenance, compare it with other evidence, and distinguish what a dataset can establish from what it cannot. That stance is democratic as well as intellectual. Independent public statistics let people argue from a shared record, while openness allows that record to be challenged and improved.
The rules are strongest when treated as linked habits rather than a mechanical checklist. Emotional self-awareness cannot repair a biased sample; a representative dataset cannot resolve a disputed definition; transparent algorithms can still pursue bad objectives. Each safeguard addresses a different failure point. The book is less a manual for proving every claim than a guide to knowing when a claim deserves confidence, further inquiry, or suspension of judgment.
Its most valuable shift is from debunking toward investigation. A clever exposure of statistical trickery can entertain while leaving the reader with no better account of reality. Curiosity demands the next step: what happened, how was it measured, and what evidence would change the conclusion? That is not certainty. It is a more dependable way to make decisions in a world where uncertainty is unavoidable and manufactured doubt is often useful to someone.
Review Summary
The Data Detective receives mostly positive reviews for its accessible approach to understanding statistics. Readers appreciate Harford's engaging storytelling and practical advice on interpreting data critically. The book's ten rules help readers navigate statistical claims and develop a curious mindset. Some reviewers found the content familiar, but most praised its relevance in today's data-driven world. Critics noted occasional bias and simplification. Overall, the book is recommended for those seeking to improve their statistical literacy and critical thinking skills.
People Also Read






Glossary
premature enumeration
Counting before definingHarford's term for beginning statistical calculations before clarifying what the quantities represent. Apparently ordinary categories, such as live birth, self-harm, or skilled work, can have multiple definitions. If those categories shift across places or time, the resulting totals may be misleading even when the arithmetic is correct.
motivated reasoning
Reasoning toward a preferred answerA way of evaluating evidence in which a person, consciously or unconsciously, is pulled toward a desired conclusion. People may accept supportive evidence readily, while scrutinizing or dismissing evidence that threatens their beliefs or interests. Intelligence and expertise do not eliminate the tendency and can sometimes supply more arguments for it.
fast statistics
Immediate, intuitive impressionsHarford's label for impressions formed quickly from personal experience, memorable events, and media exposure. These impressions can reveal vivid local details, but they are often not representative of the broader population. A dramatic news story can shape perceived risk even when long-term data show a different pattern.
slow statistics
Systematically gathered evidenceHarford's label for information assembled through deliberate, systematic measurement and comparison. Slow statistics can reveal trends and relationships that individual experience cannot detect, but they depend on sound definitions, representative collection, and appropriate analysis. They work best alongside lived experience, which can expose what broad averages leave out.
survivorship bias
Learning only from survivorsA distortion that occurs when visible cases are the ones that succeeded or survived, while failed or missing cases are overlooked. Studying only returning aircraft, successful businesses, existing investment funds, or celebrated crowdfunding projects can make risks seem smaller and success seem more replicable than it is.
publication bias
Striking results get publishedThe tendency for studies with surprising or positive findings to be published more readily than studies showing no effect or failing to replicate earlier results. The published literature can therefore exaggerate the strength or reliability of a finding. Trial registries, preregistration, and outlets for negative results help reveal the missing evidence.
garden of forking paths
Many plausible analysis choicesStatistician Andrew Gelman's term for the many reasonable decisions researchers can make about which data to collect, which outcomes to measure, and how to analyze results. Each choice creates another possible path through the analysis. Selecting the path that yields an appealing result after seeing the data can make chance patterns look convincing.
HARKing
Hypotheses formed after resultsAn acronym for Hypothesizing After Results Known. Researchers may explore data, notice a pattern, and form a hypothesis from it, which is a legitimate way to generate ideas. The problem comes when the same data are then presented as an independent test of that hypothesis. New data are needed to test the idea fairly.
dark data
Known but unobserved informationStatistician David Hand's term for information that exists but is absent from a dataset, such as opinions from people who do not respond to a poll. Analysts may know that cases are missing without knowing how those cases differ from the observed ones. Ignoring that gap can produce biased conclusions.
base rate
General frequency of an outcomeThe frequency of an outcome across a relevant comparison group, such as the share of marriages that end in divorce. Base rates provide a starting point for judging a specific case. Without them, vivid details about one person or event can lead to forecasts that are far too high or too low.
FAQ
What's The Data Detective about?
- Understanding statistics: The Data Detective by Tim Harford is about interpreting and critically evaluating statistical information in everyday life.
- Ten rules: The book presents ten rules to help readers navigate data complexities, emphasizing skepticism and curiosity.
- Combating misinformation: Harford aims to equip readers with tools to discern truth from deception, using historical and contemporary examples.
Why should I read The Data Detective?
- Practical application: It's essential for anyone encountering statistics in daily life, offering actionable advice for informed decision-making.
- Enhancing critical thinking: The book helps develop an analytical approach to interpreting statistics, crucial in an age of misinformation.
- Engaging storytelling: Harford uses compelling narratives and real-world examples to make complex concepts accessible and relatable.
What are the key takeaways of The Data Detective?
- Ten rules for understanding statistics: The book outlines rules like "Search Your Feelings" and "Get the Backstory" to guide statistical evaluation.
- Importance of context: Harford stresses that statistics should not be viewed in isolation; context is crucial for accurate interpretation.
- Skepticism and curiosity: A mindset of healthy skepticism and curiosity is advocated to question the validity of statistical claims.
What are the best quotes from The Data Detective and what do they mean?
- “You can ‘prove’ anything with statistics, it seems—even that storks deliver babies.”: Highlights the potential for statistical manipulation and the importance of critical evaluation.
- “Good statistics are not a trick, although they are a kind of magic.”: Emphasizes the power of statistics when interpreted correctly.
- “The power to not collect data is one of the most important and little-understood sources of power that governments have.”: Underscores the significance of data collection in shaping policies and public perception.
What are the ten rules outlined in The Data Detective?
- Search Your Feelings: Recognize emotional reactions to statistical claims to prevent biases.
- Ponder Your Personal Experience: Balance personal experiences with statistical evidence for broader understanding.
- Avoid Premature Enumeration: Understand what is being measured before jumping to conclusions.
- Step Back and Enjoy the View: Contextualize data to understand trends and patterns.
- Get the Backstory: Know the background of a statistic for accurate interpretation.
How does The Data Detective address the issue of misinformation?
- Highlighting statistical manipulation: Harford educates readers on tactics used to distort data through historical and contemporary examples.
- Encouraging critical evaluation: The book promotes skepticism and inquiry to question statistical claims' validity.
- Providing tools for analysis: The ten rules equip readers with practical tools to analyze and interpret statistics effectively.
What is the significance of context in understanding statistics, as discussed in The Data Detective?
- Context shapes interpretation: Statistics should not be viewed in isolation; context is crucial for accurate interpretation.
- Avoiding misinterpretation: Without context, statistics can be easily misinterpreted or manipulated.
- Enhancing understanding: A holistic approach fosters better decision-making based on data.
How can I apply the lessons from The Data Detective in my daily life?
- Practice critical thinking: Use the ten rules as a framework for evaluating statistical claims in various contexts.
- Engage with data: Seek reputable sources to inform your understanding of issues.
- Foster curiosity: Cultivate a mindset of inquiry to make better-informed decisions.
What role does emotional response play in interpreting statistics, according to The Data Detective?
- Emotions can cloud judgment: Emotional reactions can lead to biased interpretations.
- Awareness of biases: Recognizing emotional responses helps assess statistical claims' validity.
- Encouraging reflection: Pause and consider how a statistic makes you feel before concluding.
How does Tim Harford suggest we evaluate statistical claims?
- Critical Analysis: Analyze the data source, methodology, and context.
- Look for Bias: Identify potential biases in data collection and presentation.
- Seek Transparency: Advocate for transparency in data sources and algorithms.
What is the significance of transparency in statistics according to The Data Detective?
- Trust in Data: Transparency fosters trust, allowing verification of findings.
- Accountability: Open reporting holds organizations accountable for their claims.
- Improvement of Algorithms: Transparency allows scrutiny and potential improvements in design.
How does personal experience play a role in understanding statistics as per The Data Detective?
- Contextual Understanding: Personal experience helps contextualize statistical information.
- Challenge Assumptions: Reflect on experiences to challenge assumptions and biases.
- Enhancing Engagement: Connecting statistics to personal experiences fosters deeper understanding.
About the Author
Other books by Tim Harford




Download PDF
Download EPUB
.epub digital book format is ideal for reading ebooks on phones, tablets, and e-readers.








